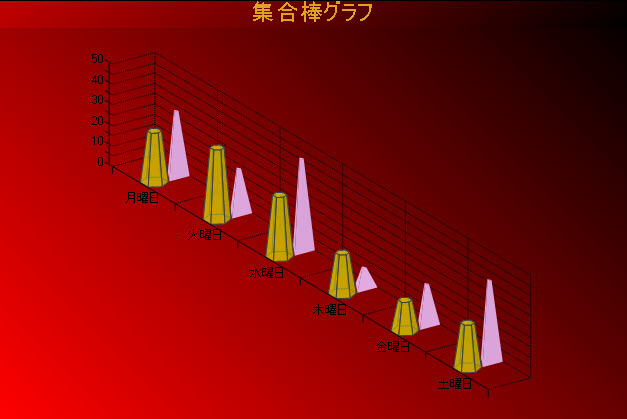
3D集合棒グラフを使用すると、カテゴリごとに項目の値を比較し、データを簡単に3D表示することができます。

注意: グラフを3D表示するには、[ChartAreaコレクションエディター]を開き、ProjectionTypeプロパティを「Identical」から「Orthogonal」に変更します。
|
グラフ情報
|
| ChartType |
ClusteredBar |
| Y値/データ点の数 |
1 |
| 系列の数 |
1つ以上 |
| マーカーサポート |
系列、またはデータ点 |
| 固有のカスタムプロパティ |
BarTopPercent: BarTypeが「Cone」、または「Custom」の場合に棒の上部に表示する割合の値を取得、または設定します。
BarType: 表示する棒のタイプを取得、または設定します。BarType列挙値を使用します。
Gap: 各X軸値の棒の間隔を取得、または設定します。
RotationAngle: カスタム3D棒形状の水平開始角度を取得、または設定します。棒のタイプがカスタム棒の場合のみ使用可能です。
VertexNumber: データ点の頂点の数を取得、または設定します。カスタム3D棒の形状の作成に使用します。棒のタイプがカスタム棒の場合のみ使用可能です。棒は3個以上の頂点を含む必要があります。 |
以下のサンプルコードは、実行時に上の図のような3D集合棒グラフのカスタムグラフプロパティを設定する方法を示します。
Visual Basic
| Visual Basicコード |
コードのコピー
|
|
' 系列1のカスタムプロパティを設定します。
Me.ChartControl1.Series(0).Properties("BarTopPercent") = 50.0F
Me.ChartControl1.Series(0).Properties("BarType") = GrapeCity.ActiveReports.Chart.BarType.Custom
Me.ChartControl1.Series(0).Properties("Gap") = 300.0F
Me.ChartControl1.Series(0).Properties("RotationAngle") = 0.0F
Me.ChartControl1.Series(0).Properties("VertexNumber") = 6
' 系列2のカスタムプロパティを設定します。
Me.ChartControl1.Series(1).Properties("BarTopPercent") = 20.0F
Me.ChartControl1.Series(1).Properties("BarType") = GrapeCity.ActiveReports.Chart.BarType.Custom
Me.ChartControl1.Series(1).Properties("Gap") = 300.0F
Me.ChartControl1.Series(1).Properties("RotationAngle") = 90.0F
Me.ChartControl1.Series(1).Properties("VertexNumber") = 3
|
C#
| C#コード |
コードのコピー
|
|
// 系列1のカスタムプロパティを設定します。
this.chartControl1.Series[0].Properties["BarTopPercent"] = 50f;
this.chartControl1.Series[0].Properties["BarType"] = GrapeCity.ActiveReports.Chart.BarType.Custom;
this.chartControl1.Series[0].Properties["Gap"] = 300f;
this.chartControl1.Series[0].Properties["RotationAngle"] = 0f;
this.chartControl1.Series[0].Properties["VertexNumber"] = 6;
// 系列2のカスタムプロパティを設定します。
this.chartControl1.Series[1].Properties["BarTopPercent"] = 20f;
this.chartControl1.Series[1].Properties["BarType"] = GrapeCity.ActiveReports.Chart.BarType.Custom;
this.chartControl1.Series[1].Properties["Gap"] = 300f;
this.chartControl1.Series[1].Properties["RotationAngle"] = 90f;
this.chartControl1.Series[1].Properties["VertexNumber"] = 3;
|
