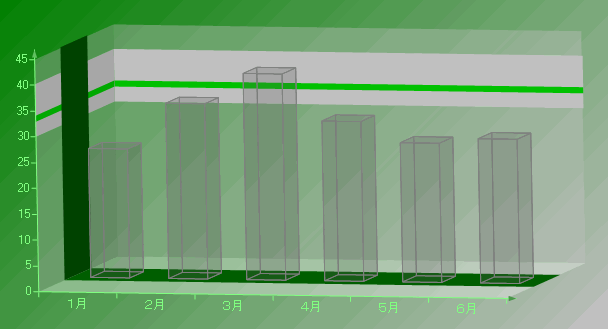
チャートコントロールは、WallRangesコレクションの使用による一定の線と縞をサポートします。これにより、グラフ内に水平または垂直方向の線や縞を表示して特定の領域を強調できます。たとえば、グラフ内に縞を描画し、データの高位に注目させたり、線を描画して表示されているデータの平均値を表示したりできます。
 |
注意:チャートコントロールには平均値を集計する機能は用意されておりません。あらかじめ平均値を集計した上で、線を描画してください。 |

重要なプロパティ
以下のサンプルコードは、実行時に壁面範囲を作成してプロパティを設定し、それらをグラフ領域に割り当てる方法を示します。結果は上図のようになります。
Visual Basic
| Visual Basicコード |
コードのコピー
|
|
' WallRangeオブジェクトを作成します。
Dim wallRange1 As New GrapeCity.ActiveReports.Chart.WallRange
Dim wallRange2 As New GrapeCity.ActiveReports.Chart.WallRange
Dim wallRange3 As New GrapeCity.ActiveReports.Chart.WallRange
' WallRangeプロパティを設定します。
With wallRange1
.Backdrop = New GrapeCity.ActiveReports.Chart.Graphics.Backdrop(Color.White)
.Border = New GrapeCity.ActiveReports.Chart.Border(New GrapeCity.ActiveReports.Chart.Graphics.Line(Color.Transparent, 0, _
GrapeCity.ActiveReports.Chart.Graphics.LineStyle.None), 0, Color.Black)
.EndValue = 40
.PrimaryAxis = ((CType(Me.ChartControl1.ChartAreas(0).Axes("AxisY"), GrapeCity.ActiveReports.Chart.Axis)))
.StartValue = 30
End With
With wallRange2
.Backdrop = New GrapeCity.ActiveReports.Chart.Graphics.Backdrop(Color.Lime)
.Border = New GrapeCity.ActiveReports.Chart.Border(New GrapeCity.ActiveReports.Chart.Graphics.Line(Color.Transparent, 0, _
GrapeCity.ActiveReports.Chart.Graphics.LineStyle.None), 0, Color.Black)
.EndValue = 34
.PrimaryAxis = ((CType(Me.ChartControl1.ChartAreas(0).Axes("AxisY"), GrapeCity.ActiveReports.Chart.Axis)))
.StartValue = 33
End With
With wallRange3
.Backdrop = New GrapeCity.ActiveReports.Chart.Graphics.Backdrop(Color.DarkGreen, CType(150, Byte))
.Border = New GrapeCity.ActiveReports.Chart.Border(New GrapeCity.ActiveReports.Chart.Graphics.Line(Color.Transparent, 0, _
GrapeCity.ActiveReports.Chart.Graphics.LineStyle.None), 0, Color.Black)
.EndValue = 40
.PrimaryAxis = ((CType(Me.ChartControl1.ChartAreas(0).Axes("AxisZ"), GrapeCity.ActiveReports.Chart.Axis)))
.StartValue = 20
End With
' WallRangeをグラフ領域に追加し、壁面とZ軸のプロパティを設定して線を表示させます。
With ChartControl1.ChartAreas(0)
.WallRanges.AddRange(New GrapeCity.ActiveReports.Chart.WallRange() {wallRange1, wallRange2, wallRange3})
.WallXY.Backdrop.Alpha = 100
.WallXZ.Backdrop.Alpha = 100
.WallYZ.Backdrop.Alpha = 100
.Axes(4).MajorTick.Step = 20
.Axes(4).Max = 60
.Axes(4).Min = 0
.Axes(4).Visible = True
End With
|
C#
| C#コード |
コードのコピー
|
|
// 壁面範囲オブジェクトを作成します。
GrapeCity.ActiveReports.Chart.WallRange wallRange1 = new GrapeCity.ActiveReports.Chart.WallRange();
GrapeCity.ActiveReports.Chart.WallRange wallRange2 = new GrapeCity.ActiveReports.Chart.WallRange();
GrapeCity.ActiveReports.Chart.WallRange wallRange3 = new GrapeCity.ActiveReports.Chart.WallRange();
// 壁面範囲プロパティを設定します。
wallRange1.Backdrop = new GrapeCity.ActiveReports.Chart.Graphics.Backdrop(System.Drawing.Color.White);
wallRange1.Border = new GrapeCity.ActiveReports.Chart.Border(new GrapeCity.ActiveReports.Chart.Graphics.Line
(System.Drawing.Color.Transparent, 0, GrapeCity.ActiveReports.Chart.Graphics.LineStyle.None),
0, System.Drawing.Color.Black);
wallRange1.EndValue = 40;
wallRange1.PrimaryAxis = (GrapeCity.ActiveReports.Chart.Axis)this.chartControl1.ChartAreas[0].Axes["AxisY"];
wallRange1.StartValue = 30;
wallRange2.Backdrop = new GrapeCity.ActiveReports.Chart.Graphics.Backdrop(System.Drawing.Color.Lime);
wallRange2.Border = new GrapeCity.ActiveReports.Chart.Border(new GrapeCity.ActiveReports.Chart.Graphics.Line
(System.Drawing.Color.Transparent, 0, GrapeCity.ActiveReports.Chart.Graphics.LineStyle.None),
0, System.Drawing.Color.Black);
wallRange2.EndValue = 34;
wallRange2.PrimaryAxis = (GrapeCity.ActiveReports.Chart.Axis)this.chartControl1.ChartAreas[0].Axes["AxisY"];
wallRange2.StartValue = 33;
wallRange3.Backdrop = new GrapeCity.ActiveReports.Chart.Graphics.Backdrop(System.Drawing.Color.DarkGreen);
wallRange3.Border = new GrapeCity.ActiveReports.Chart.Border(new GrapeCity.ActiveReports.Chart.Graphics.Line
(System.Drawing.Color.Transparent, 0, GrapeCity.ActiveReports.Chart.Graphics.LineStyle.None),
0, System.Drawing.Color.Black);
wallRange3.EndValue = 40;
wallRange3.PrimaryAxis = (GrapeCity.ActiveReports.Chart.Axis)this.chartControl1.ChartAreas[0].Axes["AxisZ"];
wallRange3.StartValue = 20;
// 壁面範囲をグラフ領域に追加し、壁面とZ軸のプロパティを設定して線を表示させます。
this.chartControl1.ChartAreas[0].WallRanges.AddRange(
new GrapeCity.ActiveReports.Chart.WallRange[] {wallRange1,wallRange2,wallRange3});
this.chartControl1.ChartAreas[0].WallXY.Backdrop.Alpha = 100;
this.chartControl1.ChartAreas[0].WallXZ.Backdrop.Alpha = 100;
this.chartControl1.ChartAreas[0].WallYZ.Backdrop.Alpha = 100;
this.chartControl1.ChartAreas[0].Axes[4].MajorTick.Step = 20;
this.chartControl1.ChartAreas[0].Axes[4].Max = 60;
this.chartControl1.ChartAreas[0].Axes[4].Min = 0;
this.chartControl1.ChartAreas[0].Axes[4].Visible = true;
|

