注釈は、重要なニュースまたはイベントをマークするために、FinancialChart上の特定のデータポイントにアタッチして使用されます。ユーザーがイベント上にマウスポインタを置くと、注釈の全文が表示されます。FinancialChartのwijbarchart の場合、ユーザーはテキスト、図形、画像などさまざまな種類の注釈をグラフに追加できます。画像とテキスト以外、Wijmoのグラフでは、円、楕円、線、多角形、四角形、正方形などさまざまな組み込み図形が対応されています。
FlexChart上の注釈の位置は、AnnotationPositionプロパティをBottom、Center、Left、Right、またはTopに設定することで指定できます。FlexChartで注釈の添付を指定するには、AnnotationAttachmentプロパティを使用し、その値を次のように設定します。
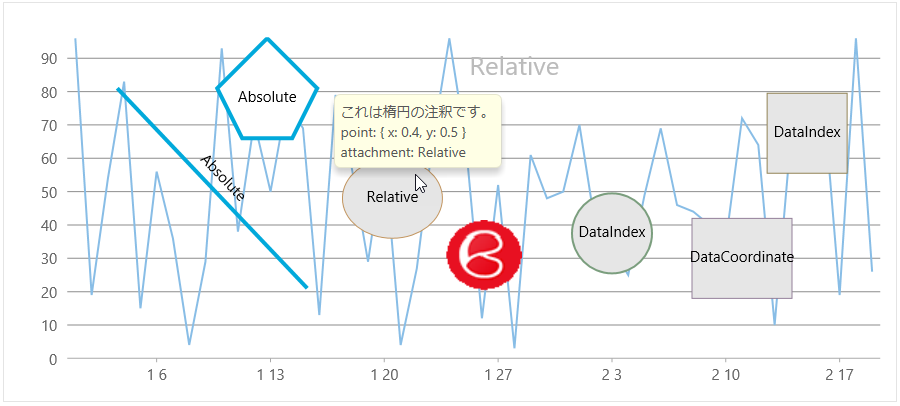
- Absolute:注釈ポイントは、コントロールのピクセル座標で指定されます。
- DataCoordinate:注釈ポイントは、データ座標で指定されます。
- DataIndex:注釈ポイントの座標は、データ系列インデックスとデータポイントインデックスで定義されます。
- Relative:注釈ポイントは、コントロール内の相対位置で指定されます。(0,0)が左上隅、(1,1)が右下隅になります。
このセクションでは、MVC WebアプリケーションのFlexChartコントロールに注釈を追加する方法を説明します。
このトピックは3つの手順で構成されます。
次の図は、上記の手順を実行した後のFlexChartを示しています。
手順1:FlexChartのデータソースの作成
- [モデル]フォルダに新しいクラスを追加します(例:
Sale.cs)。新しいモデルの追加方法については、「コントロールの追加」を参照してください。 - 次のコードを新しいモデルに追加して、FlexChartコントロールのデータソースになるクラスを定義します。
C# コードのコピーpublic class Sale { public int ID { get; set; } public DateTime Start { get; set; } public DateTime End { get; set; } public string Country { get; set; } public string Product { get; set; } public string Color { get; set; } public double Amount { get; set; } public double Amount2 { get; set; } public double Discount { get; set; } public bool Active { get; set; } public MonthData[] Trends { get; set; } public int Rank { get; set; } private static List<string> COUNTRIES = new List<string> { "US", "UK", "Canada", "Japan", "China", "France", "German", "Italy", "Korea", "Australia" }; private static List<string> PRODUCTS = new List<string> { "Widget", "Gadget", "Doohickey" }; /// <summary> /// データを取得します。 /// </summary> /// <param name="total"></param> /// <returns></returns> public static IEnumerable<Sale> GetData(int total) { var colors = new[] { "Black", "White", "Red", "Green", "Blue" }; var rand = new Random(0); var dt = DateTime.Now; var list = Enumerable.Range(0, total).Select(i => { var country = COUNTRIES[rand.Next(0, COUNTRIES.Count - 1)]; var product = PRODUCTS[rand.Next(0, PRODUCTS.Count - 1)]; var color = colors[rand.Next(0, colors.Length - 1)]; var startDate = new DateTime(dt.Year, i % 12 + 1, 25); var endDate = new DateTime(dt.Year, i % 12 + 1, 25, i % 24, i % 60, i % 60); return new Sale { ID = i + 1, Start = startDate, End = endDate, Country = country, Product = product, Color = color, Amount = Math.Round(rand.NextDouble() * 10000 - 5000, 2), Amount2 = Math.Round(rand.NextDouble() * 10000 - 5000, 2), Discount = Math.Round(rand.NextDouble() / 4, 2), Active = (i % 4 == 0), Trends = Enumerable.Range(0, 12).Select(x => new MonthData { Month = x + 1, Data = rand.Next(0, 100) }).ToArray(), Rank = rand.Next(1, 6) }; }); return list; } public static List<string> GetCountries() { var countries = new List<string>(); countries.AddRange(COUNTRIES); return countries; } public static List<string> GetProducts() { List<string> products = new List<string>(); products.AddRange(PRODUCTS); return products; } } public class BasicSale { public int Sale { get; set; } public DateTime Date { get; set; } public BasicSale(int sale, DateTime date) { Sale = sale; Date = date; } public static List<BasicSale> GetBasicSales() { List<BasicSale> list = new List<BasicSale>(); int[] sales = { 96, 19, 54, 83, 15, 56, 36, 4, 29, 93, 38, 71, 50, 77, 69, 13, 79, 57, 29, 62, 4, 27, 66, 96, 65, 12, 52, 3, 61, 48, 50, 70, 39, 33, 25, 49, 69, 46, 44, 40, 35, 72, 64, 10, 66, 63, 78, 19, 96, 26}; for (int i = 0; i < sales.Length; i++) { list.Add(new BasicSale(sales[i], new DateTime(2014, i / 31 + 1, i % 31 + 1))); } return list; } }
手順2:FlexChartコントロールの初期化と注釈の追加
FlexChartコントロールを初期化して注釈を追加するには、次の手順を実行します。
新しいコントローラーの追加
- ソリューションエクスプローラーで、[コントローラー]フォルダを右クリックします。
- コンテキストメニューから、[追加]→[コントローラー]を選択します。[コントローラーの追加]ダイアログが表示されます。
-
[コントローラーの追加]ダイアログで、次の手順を実行します。
- コントローラーの名前を設定します(例:Default1Controller)。
- [MVC 5 コントローラー -空]テンプレートを選択します。
- [追加]をクリックします。
- メソッド
Index()を次のメソッドに置き換えます。C# コードのコピーpublic ActionResult Index() { return View(BasicSale.GetBasicSales()); }
コントローラーのビューの追加
- ソリューションエクスプローラーで、[コントローラー]フォルダを展開し、コントローラー
AnnotationControllerをダブルクリックして開きます。 - メソッド
Index()内にカーソルを置きます。 - 右クリックし、[ビューの追加]を選択します。[ビューの追加]ダイアログが表示されます。
- [ビューの追加]ダイアログで、ビュー名がIndex、ビューエンジンがRazor (CSHTML)であることを確認します。
- [追加]をクリックします。コントローラーにビューが追加されます。
- QuickStartビューのFlexChartコントロールを次のようにインスタンス化します。
例では、C1logo画像を使用してFlexChartの画像注釈を表示します。画像は、システムのC:\Users\<username>\Documents\ComponentOne Samples\ASP.NET MVC\MVC\MvcExplorer\Content\images\c1logo.png に用意されています。
Razor コードのコピー@using MVCFinancialChart.Models @using C1.Web.Mvc @using C1.Web.Mvc.Chart @using System.Drawing @model IEnumerable<BasicSale> @*ツールチップ上で表示するデータを追加します。*@ @{ var lineTooltip = "線注釈を表します。 </br> start: { x: 50, y: 150 } end: { x: 240, y: 350 } </br> attachment: Absolute"; var textTooltip = "テキスト注釈を表します。</br> point: { x: 0.55, y: 0.15 }</br> attachment: Relative"; var ellipseTooltip = "楕円注釈を表します。</br> point: { x: 0.4, y: 0.5 }</br> attachment: Relative"; var rectTooltip = "四角形注釈を表します。</br> point:{ x: new DateTime(2014, 2, 11), y: 30 }</br> attachment: DataCoordinate"; var imageTooltip = "イメージ注釈を表します。</br> point:{x: new DateTime(2014, 1, 26), y: 30}</br> attachment: DataCoordinate"; } @*FlexChart を初期化します。*@ @(Html.C1().FlexChart().Width(1000).Bind(Model) .BindingX("Date").Series(series => { series.Add().Binding("Sale").ChartType(C1.Web.Mvc.Chart.ChartType.Line); }).AxisX(x => x.Format("yyyy年/MM月/dd日")) //注釈レイヤーを追加します。Add Annotation layer .AddAnnotationLayer(layer => { //線注釈を追加します。 layer.AddLine(line => line.Attachment(AnnotationAttachment.Absolute) .Position(AnnotationPosition.Center) .Content("Absolute") .Start(new DataPoint(50, 150)) .End(new DataPoint(240, 350)) .Tooltip(lineTooltip) .Style(style => style.Stroke("#17EAA5").StrokeWidth(4) )); //テキスト注釈を追加します。 layer.AddText(text => text.Attachment(AnnotationAttachment.Relative) .Content("Relative") .Position(AnnotationPosition.Center) .Point(new DataPoint(0.55, 0.15)) .Tooltip(textTooltip) .Style(style => style.Fill("#EA4C17").FontSize(26)) ); //楕円注釈を追加します。 layer.AddEllipse(ellipse => ellipse.Attachment(AnnotationAttachment.Relative) .Position(AnnotationPosition.Center) .Point(new DataPoint(0.4, 0.5)) .Width(100).Height(80) .Content("Relative") .Tooltip(ellipseTooltip) .Style(style => style.Fill("#EAD617").Stroke("#A1840D")) ); //四角形注釈を追加します。 layer.AddRectangle(rectangle => rectangle.Attachment(AnnotationAttachment.DataCoordinate) .Point(new DataPoint(new DateTime(2014, 2, 11), 30)) .Content("DataCoordinate") .Position(AnnotationPosition.Center) .Tooltip(rectTooltip) .Style(style => style.Fill("#F6C8F0").Stroke("#F947FB")) ); //イメージ注釈を追加します。 layer.AddImage(image => image.Attachment(AnnotationAttachment.DataCoordinate) .Href("/Content/images/c1logo.png") .Point(new DataPoint(new DateTime(2014, 1, 26), 30)) .Width(80).Height(80) .Tooltip(imageTooltip) ); }) )
手順3:プロジェクトのビルドおよび実行
- [ビルド]→[ソリューションのビルド]をクリックして、プロジェクトをビルドします。
-
[F5]キーを押してプロジェクトを実行します。
ブラウザのアドレスバーで、生成されたURLにフォルダ名とビュー名を付加してビューを確認します(例:http://localhost:1234/Annotation/Index)。