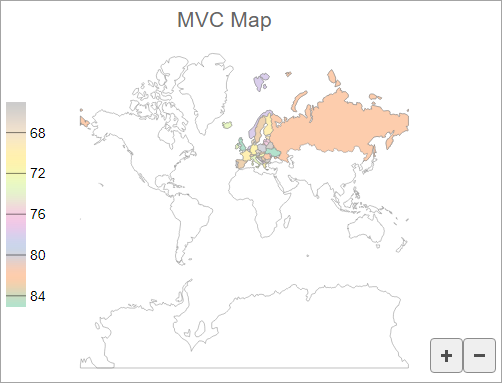
Legend is an element which can be used to display a list of colors, symbols and text corresponding to each data or data series drawn on the map. You can add legend to the map using the Legend property and specify its position to display the legend on the map. The Legend property accepts the Position property as a parameter which sets the legend's position through Position enumeration.
The following image shows how the legend appears when you set the position of the legend to Left.

The following code example demonstrates how to set the position of a legend.
| Index |
コードのコピー
|
|---|---|
@using System.Drawing

<script>
    function colorScale(v) {
        return 1 - v;
    }
    function colorScaleBindingEurope(o) {
        return o.properties.name.charCodeAt(0);
    }
</script>

@(Html.C1().FlexMap().Id("flexMap")
                .Header("MVC Map")
                .Height(400)
                .Legend(C1.Web.Mvc.Chart.Position.Left)
                .Layers(ls =>
                {
                    ls.AddGeoMapLayer()
                        .Url("/Content/data/land.json");

                    ls.AddGeoMapLayer()
                        .Url("/Content/data/europe.json")
                        .ColorScale(cs => cs.Scale("colorScale")
                                            .Binding("colorScaleBindingEurope")
                                            .Colors(C1.Web.Mvc.Chart.Palettes.Qualitative.Pastel2));
                })
)
|
|