この手順では、アプリケーションを実行し、新しいデータやグラフ要素(X 軸と Y 軸のタイトル、グラフヘッダー、およびグラフラベルなど)を観察します。
- F5 を押して、アプリケーションを実行します。
- 以下を観察します。
- 任意のグラフ系列の上にホバーします。ツールチップにラベルプロパティの値やその系列の Y 値の説明が表示されることに注意してください。 ツールチップは次のコードを使用したときに表示されます。
ソースビュー コードのコピーhint: { content: function () { return this.data.lineSeries.label + '\n' + this.x + '' + this.y + ''; }, contentStyle: { "font-size": "10pt" }, offsetY: -10 },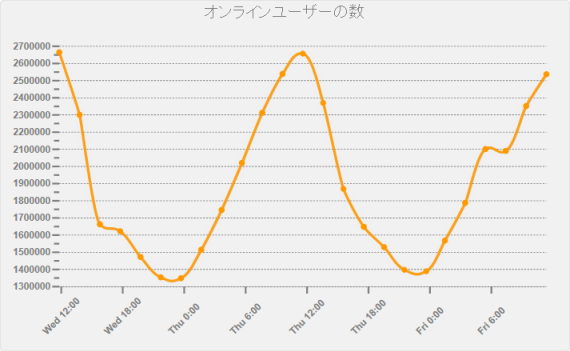
- 次のコードを使用すると、グラフヘッダーのタイトルが表示されることに注意してください。
ソースビュー コードのコピーheader: { visible: true, text: "オンラインユーザーの数", textStyle: { fill: "#fafafa" } }, - データ系列に文字列の X データと数値の Y データを表示します。次のコードを使用し、この結果を達成します。
ソースビュー コードのコピーseriesList: [ { label: "オンラインユーザーの数", legendEntry: true, fitType: "spline", data: { x: [new Date('10/27/2010 11:48:00'), new Date('10/27/2010 13:47:00'), new Date('10/27/2010 15:46:00'), new Date('10/27/2010 17:45:00'), new Date('10/27/2010 19:44:00'), new Date('10/27/2010 21:43:00'), new Date('10/27/2010 23:41:00'), new Date('10/28/2010 1:40:00'), new Date('10/28/2010 3:39:00'), new Date('10/28/2010 5:38:00'), new Date('10/28/2010 7:37:00'), new Date('10/28/2010 9:36:00'), new Date('10/28/2010 11:35:00'), new Date('10/28/2010 13:34:00'), new Date('10/28/2010 15:33:00'), new Date('10/28/2010 17:32:00'), new Date('10/28/2010 19:31:00'), new Date ('10/28/2010 21:30:00'), new Date('10/28/2010 23:38:00'), new Date('10/29/2010 1:27:00'), new Date('10/29/2010 3:26:00'), new Date('10/29/2010 5:25:00'), new Date('10/29/2010 7:24:00'), new Date('10/29/2010 9:23:00'), new Date('10/29/2010 11:22:00')], y: [2665513, 2300921, 1663229, 1622528, 1472847, 1354026, 1348909, 1514946, 1746392, 2020481, 2312976, 2539210, 2657505, 2369938, 1869805, 1648695, 1529983, 1398148, 1389668, 1568134, 1787466, 2101460, 2090771, 2351994, 2537400] }, markers: { visible: true, type: "circle" } } ],
- 任意のグラフ系列の上にホバーします。ツールチップにラベルプロパティの値やその系列の Y 値の説明が表示されることに注意してください。 ツールチップは次のコードを使用したときに表示されます。