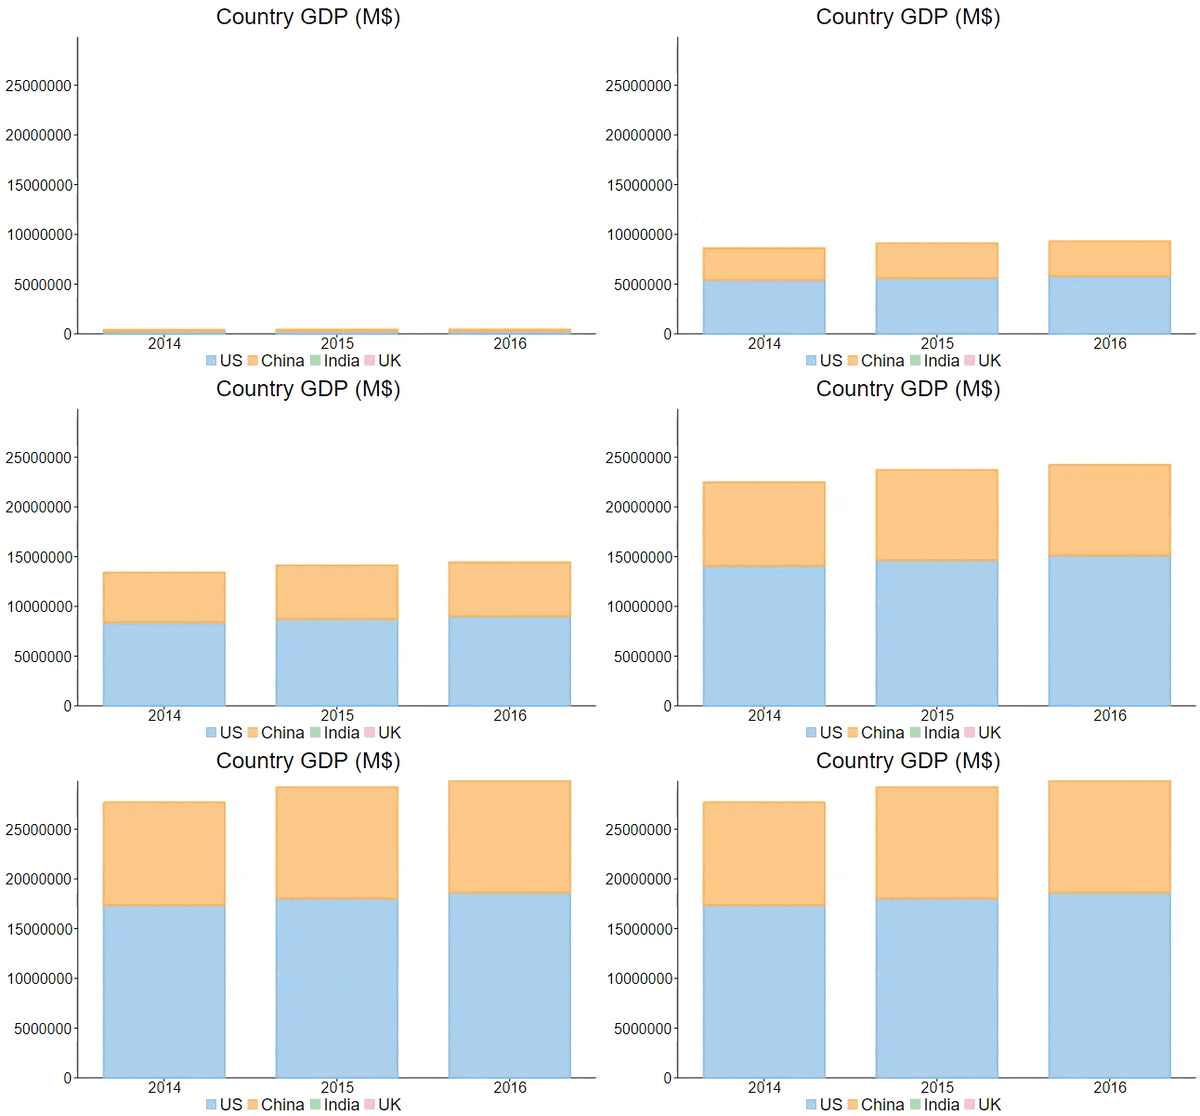
Animation gives an edge to any application and enhances the user experience by bringing life to its otherwise static elements. FlexChart provides built-in animation while loading and updating the data in a chart and enables animation for all the chart elements. It allows you to apply chart animation effects through a combination of different properties available in the FlexChart class.
The FlexChart class provides AnimationSettings property to animate the charts. The AnimationSettings property uses the AnimationSettings enumeration to allow animation while the data loads or updates, or in all situations. In addition, FlexChart class allows you to set the duration (in milliseconds) of the animation using the AnimationDuration property.
The following GIF showcases animation in a column chart.

The following code example demonstrates how to enable chart animation.
| Animation.razor |
コードのコピー
|
|---|---|
@using C1.Chart; @using C1.Blazor.Chart; <FlexChart Class="chart" ChartType="ChartType.Column" Stacking="Stacking.Stacked" HeaderContent="Country GDP (M$)" HeaderStyle="font-size:24px" LegendPosition="Position.Bottom" LegendStyle="font-size:18px" BindingX="year" ItemsSource="@GdpDataSource.GetCountryGdp()" AnimationSettings="AnimationSettings.All" AnimationDuration="1000"> <SeriesCollection> <Series Name="US" Binding="US" /> <Series Name="China" Binding="China" /> <Series Name="India" Binding="India" /> <Series Name="UK" Binding="UK" /> </SeriesCollection> <AxisCollection> <Axis AxisType="AxisType.X" Position="Position.Bottom" /> <Axis AxisType="AxisType.Y" Position="Position.Left" /> </AxisCollection> </FlexChart> @code { public class GdpDataSource { public static List<object> GetCountryGdp() { return new List<object> { new { year = "2014", US = 17348075, China = 10356508, }, new { year = "2015", US = 18036650, China =11181556, }, new { year = "2016", US = 18624450, China = 11232110, } }; } } } |
|