注釈は、チャート上の注目すべきポイントや領域を強調表示するために使用されます。注釈は、画像、図形、テキストなどの任意の要素をチャート上に配置するためにも使用できます。FlexChartコントロールは、四角形、正方形、円、楕円、線、多角形、画像、テキストなどのさまざまな注釈をサポートします。
The annotations may be attached to specific data points or to arbitrary points in data or page coordinates and have common properties as shown in the following table:
| Annotation Properties | Description |
|---|---|
| Attachment |
アタッチの方法を設定します。詳細については、次の「Annotation Attachments」セクションを参照してください。 |
| Content | Sets the annotation's textual content. |
| Position |
AnnotationPosition 列挙を使用してアタッチポイントに対する位置を設定します。 |
| Location | Sets the location of the annotation. |
| Point |
アタッチ方法がDataCoordinateまたはAbsoluteの場合の注釈の座標を設定します。 |
| PointIndex | 注釈のデータポイントインデックスを設定します。attachmentプロパティがDataIndexに設定されている場合にのみ適用されます。 |
| SeriesIndex | 注釈のデータ系列インデックスを設定します。attachmentプロパティがDataIndexに設定されている場合にのみ適用されます。 |
| ContentStyle | Sets the style of the annotation's content. |
| Style | Sets the style properties that specifies styling attributes. |
| TooltipText | Sets the tooltip of the annotation. |
注釈のアタッチ
FlexChartの注釈は、次のアタッチ方法をサポートしています。To specify the annotation attachment in FlexChart, you can use the Attachment property and set it to any of the following values using the AnnotationAttachment enumeration.
- DataIndex: 注釈ポイントの座標は、データ系列インデックスとデータポイントインデックスで定義されます。
- DataCoordinate: 注釈ポイントは、データ座標で指定されます。
- Relative: 注釈ポイントは、コントロール内の相対位置で指定されます。(0,0)が左上隅、(1,1)が右下隅になります。
- Absolute: 注釈ポイントは、コントロールのピクセル座標で指定されます。
注釈を追加する
FlexChartに注釈を追加するには、次の手順に従います。
- チャートにアタッチするAnnotationLayerを作成します。
- このレイヤに楕円、四角形、画像、テキストなどの注釈オブジェクトを設定します。
- 各注釈のAttachmentプロパティを設定して、注釈をどのようにチャートにアタッチするかを決定します。
- 注釈がポイントにアタッチされる場合は、注釈にPointIndex やSeriesIndex などの追加プロパティを設定します。
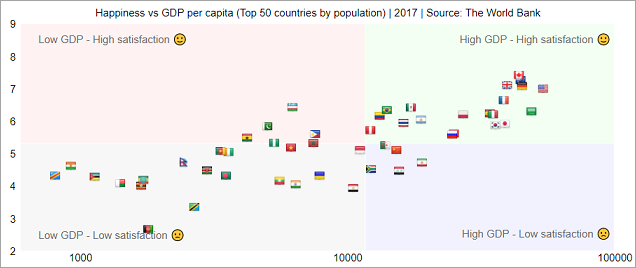
The following code demonstrates how to add annotations to a FlexChart using the above steps. In this example, the annotations are used to display plot quadrants as well as country flags as shown in the image below.

| Annotation.razor |
コードのコピー
|
|---|---|
@using C1.Chart; @using C1.Blazor.Chart; @using C1.Chart.Annotation; @using C1.Blazor.Chart.Annotation; @using System.Drawing; @using System.IO; @using System.Reflection; <FlexChart @ref="chart" Class="chart" ChartType="ChartType.Scatter" BindingX="GDP" Binding="Happiness,Population" ItemsSource="Data" HeaderContent="Happiness vs GDP per capita (Top 50 countries by population) | 2017 | Source: The World Bank"> <SeriesCollection> <Series /> </SeriesCollection> <AxisCollection> <Axis Min="600" Max="100000" AxisType="AxisType.X" LogBase="10" Position="Position.Bottom" AxisLine="false" MajorTickMarks="TickMark.None" /> <Axis Min="2" Max="9" AxisType="AxisType.Y" Position="Position.Left" AxisLine="false" MajorTickMarks="TickMark.None" /> </AxisCollection> </FlexChart> @code { FlexChart chart; GdpVsHappiness.CountryData[] Data; protected override void OnInitialized() { Data = GdpVsHappiness.GetData(); } protected override void OnAfterRender(bool firstRender) { base.OnAfterRender(firstRender); if (firstRender) CreateAnnotations(); } void CreateAnnotations() { var al = new AnnotationLayer(chart); var minx = chart.AxisX.Min; var maxx = chart.AxisX.Max; var medx = GdpVsHappiness.GdpMedian(); var miny = chart.AxisY.Min; var maxy = chart.AxisY.Max; var medy = GdpVsHappiness.HappinessMedian(); CreateQuadrant(al, 0, "Low GDP - Low satisfaction ??", "rgba(100,100,100,0.05)", minx, miny, medx - minx, medy - miny); CreateQuadrant(al, 2, "Low GDP - High satisfaction ??", "rgba(255,0,0,0.05)", minx, medy, medx - minx, maxy - medy); CreateQuadrant(al, 1, "High GDP - Low satisfaction ??", "rgba(0,0,255,0.05)", medx, miny, maxx - medx, medy - miny); CreateQuadrant(al, 3, "High GDP - High satisfaction ??", "rgba(0,255,0,0.05)", medx, medy, maxx - medx, maxy - medy); var len = Data.Length; for (int i = len - 1; i >= 0; i--) { var item = Data[i]; var sz = 16; var path = string.Format("https://raw.githubusercontent.com/gosquared/flags/master/flags/flags-iso/shiny/{0}/{1}.png", sz, item.Code); var img = new C1.Blazor.Chart.Annotation.Image(path, sz, sz); img.Attachment = AnnotationAttachment.DataIndex; img.PointIndex = i; img.TooltipText = item.Country; al.Annotations.Add(img); } } void CreateQuadrant(AnnotationLayer al, int i, string s, string clr, double x, double y, double w, double h) { var el = new C1.Blazor.Chart.Annotation.Polygon(); el.Attachment = AnnotationAttachment.DataCoordinate; el.Points.Add(new PointF((float)x, (float)y)); el.Points.Add(new PointF((float)(x + w), (float)y)); el.Points.Add(new PointF((float)(x + w), (float)(y + h))); el.Points.Add(new PointF((float)x, (float)(y + h))); el.Style = string.Format("background:{0};color:white;", clr); al.Annotations.Add(el); var text = new Text(s); text.Attachment = AnnotationAttachment.DataCoordinate; text.Position = AnnotationPosition.Right; switch (i) { case 0: text.Location = new PointF((float)(x + 100), (float)y + 0.5f); break; case 1: text.Position = AnnotationPosition.Left; text.Location = new PointF((float)(x + w - 10000), (float)y + 0.5f); break; case 2: text.Location = new PointF((float)(x + 100), (float)(y + h - 0.5)); break; case 3: text.Position = AnnotationPosition.Left; text.Location = new PointF((float)(x + w - 10000), (float)(y + h - 0.5f)); break; } al.Annotations.Add(text); } public class GdpVsHappiness { public class CountryData { public string Country { get; set; } public string Code { get; set; } public double GDP { get; set; } public double Happiness { get; set; } public double Population { get; set; } } static CountryData[] _data; static CountryData[] ReadData() { using (var stream = Assembly.GetExecutingAssembly().GetManifestResourceStream("../Data/GdpVsHappiness.json")) { using (var sr = new StreamReader(stream)) { return System.Text.Json.JsonSerializer.Deserialize<CountryData[]>(sr.ReadToEnd()); } } } public static CountryData[] GetData() { if (_data == null) { _data = ReadData(); } return _data; } public static double GdpMedian() { return Median(GetData().Select(o => o.GDP)); } public static double HappinessMedian() { return Median(GetData().Select(o => o.Happiness)); } static double Median(IEnumerable<double> source) { var data = source.OrderBy(n => n).ToArray(); if (data.Length % 2 == 0) return (data[data.Length / 2 - 1] + data[data.Length / 2]) / 2.0; return data[data.Length / 2]; } } } |
|