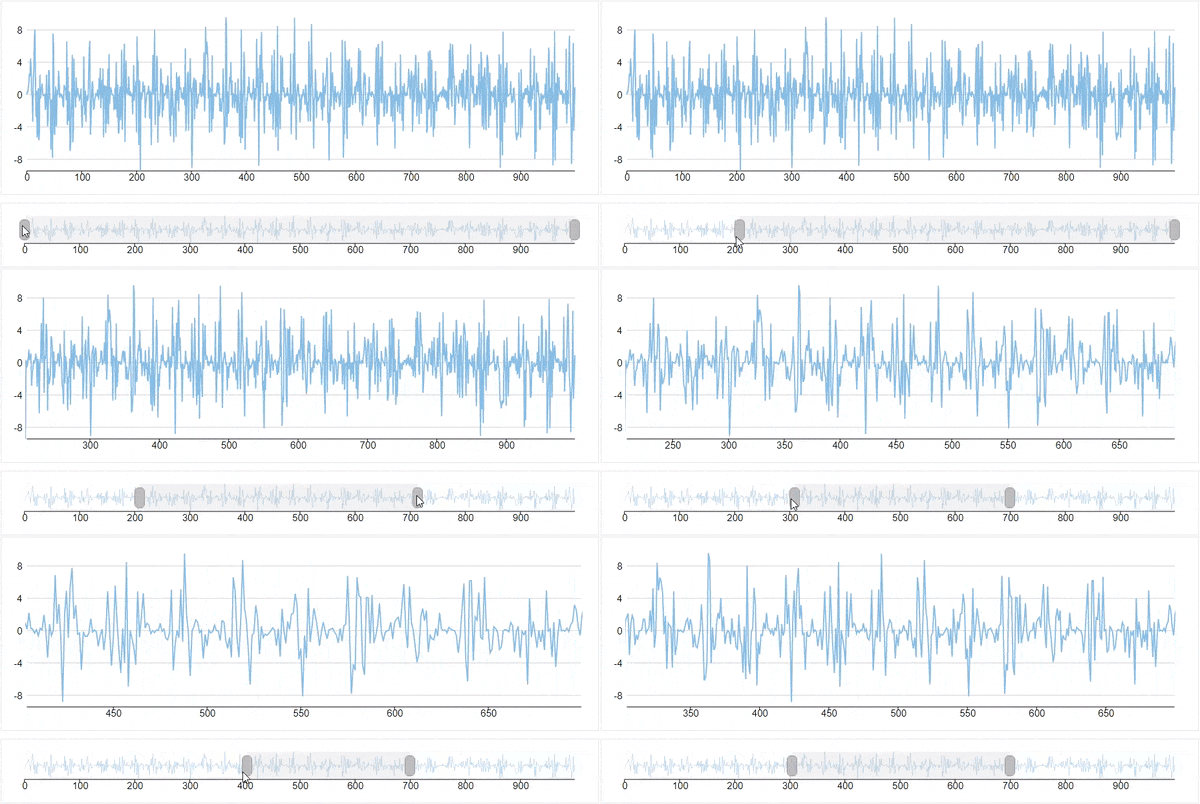
Range selector is a modern approach of scrolling the charts with huge data. In this case, instead of usual scroll bars, another broad view chart is displayed so that end-user can select the desired range more precisely and effectively. Just like axis scroll bars, range selector also acts as a tool for end-user for analyzing the selected range of data in detail. Analysis of stock charts is one of the good example where a range selector is used.

FlexChart の範囲セレクタでは、下限値スクロールボックスと上限値スクロールボックスを使用して数値データの範囲を選択できます。これらのスクロールボックスは、範囲の開始値と終了値を定義します。範囲バーでスクロールボックスを左(または下)にドラッグすると値が減少し、右(または上)にドラッグすると値が増加します。
FlexChart provides RangeSelector class which represents a chart's range selector. 範囲セレクタを追加するには、RangeSelector クラスのインスタンスを作成し、FlexChartクラスのRangeSelectorプロパティに割り当てる必要があります。In the following example,we demonstrate how to display a range selector on the FlexChart.
| RangeSelector.razor |
コードのコピー
|
|---|---|
@using C1.Chart; @using C1.Blazor.Chart; @using C1.Blazor.Chart.Interaction; <FlexChart @ref="chart" Class="chart chart-middle" ChartType="ChartType.Line" Style="height:200px;" BindingX="Day" ItemsSource="Data"> <SeriesCollection> <Series Binding="Value" /> </SeriesCollection> </FlexChart> <FlexChart @ref="chartOverview" Class="chart chart-small" ItemsSource="Data" ChartType="ChartType.Line" Binding="Value" Style="height:60px;" BindingX="Day" Tooltip="" RangeSelector="rs"> <SeriesCollection> <Series Style="stroke-width:0.5px;" /> </SeriesCollection> <AxisCollection> <Axis Position="Position.None" AxisType="AxisType.Y" /> <Axis Position="Position.Bottom" AxisType="AxisType.X" /> </AxisCollection> </FlexChart> @code { C1.Blazor.Chart.Interaction.RangeSelector rs = new C1.Blazor.Chart.Interaction.RangeSelector(); FlexChart chart; FlexChart chartOverview; List<DataSource.Quote> Data { get; set; } protected override void OnInitialized() { Data = DataSource.GetData(); rs.ValueChanged += (s, e) => { chart.BeginUpdate(); var amin = chartOverview.AxisX.ActualMin; var amax = chartOverview.AxisX.ActualMax; chart.AxisX.Min = amin + rs.LowerValue * (amax - amin); chart.AxisX.Max = amin + rs.UpperValue * (amax - amin); chart.EndUpdate(); }; } public class DataSource { private static Random rnd = new Random(); public class Quote { public int Day { get; set; } public double Value { get; set; } } public static List<Quote> GetData() { var data = new List<Quote>(); for (int i = 0; i < 1000; i++) { var r = rnd.NextDouble(); var y = (10 * r * Math.Sin(0.1 * i) * Math.Sin(0.6 * rnd.NextDouble() * i)); var country = new Quote { Day = i, Value = y }; data.Add(country); } return data; } } } |
|