DataFilter for WinForms
FlexChart との DataFilter の使用
チュートリアル > FlexChart との DataFilter の使用

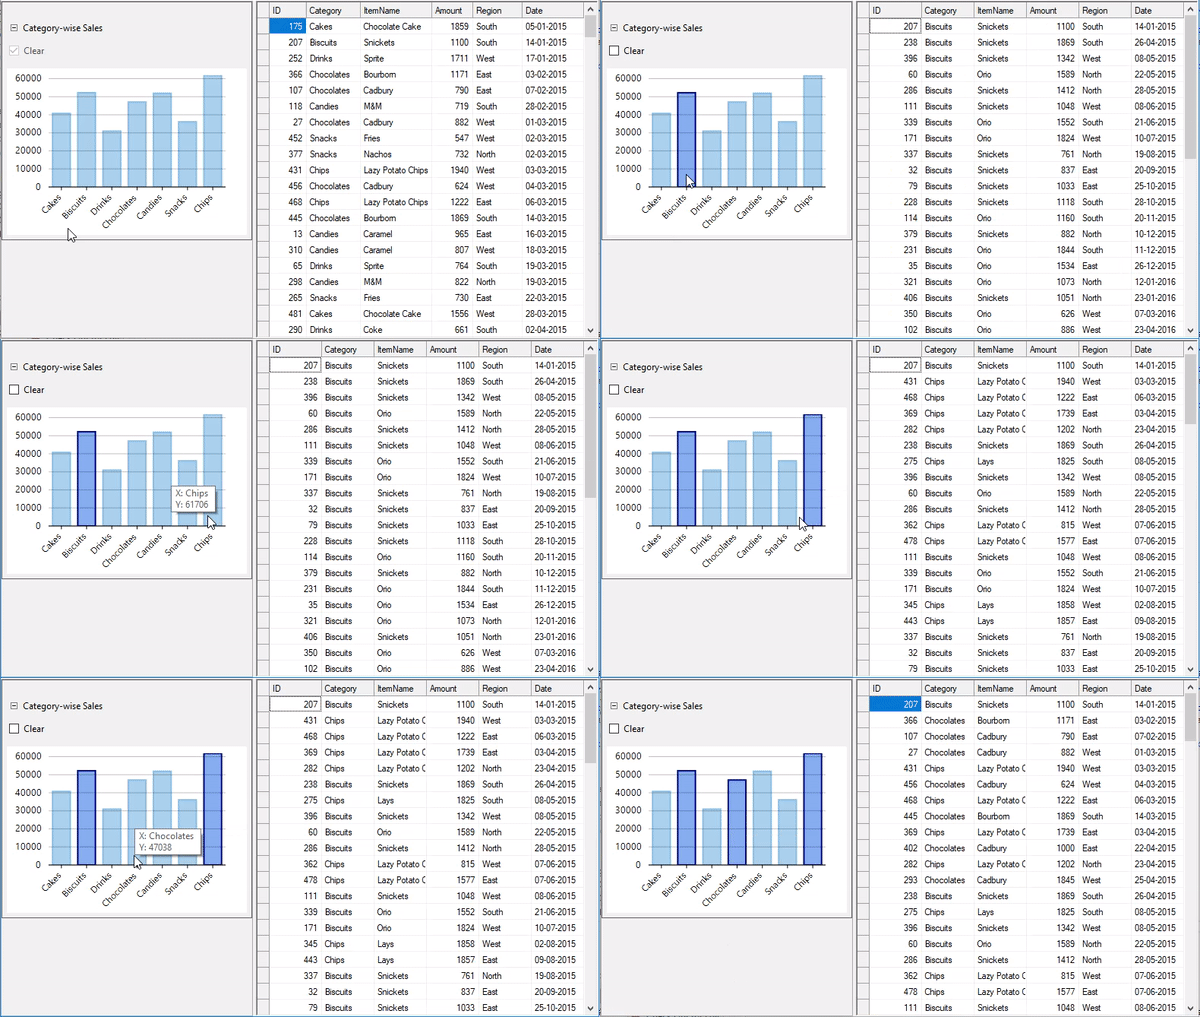
DataFilter allows you to add different controls as custom filters. The custom filters can be added to DataFilter for filtering data using complex data visualization controls, such as FlexChart and Maps. This walkthrough uses FlexChart as a custom filter in DataFilter to filter FlexGrid data.

To create a custom filter using FlexChart, complete the following steps:

  1. Set up the Application UI
  2. Create the View
  3. Create a Custom Filter
  4. Use the Custom Filter with DataFilter

The following GIF shows FlexGrid data getting filtered based on the category selection in the custom filter "Category-wise Sales" from the DataFilter UI:
Step 1: Setting up the Application UI

  1. Create a new Windows Forms App.
  2. Drag and drop the MS SplitContainer from the Toolbox onto your form to create separate panels for placing controls.
  3. Drag and drop the DataFilter control from the Toolbox onto Panel1 of the SplitContainer control to display the custom filter. Set its Dock property to Fill.
  4. Drag and drop the FlexGrid control from the Toolbox onto Panel2 of the SplitContainer control to display sales data. Set its Dock property to Fill.
Back to Top

Step 2: Create the View

  1. Create a class named FlexChartFilterView to be used as a View for using FlexChart as a Filter and update the class constructor using the following code.
    Private _selectedIndices As List(Of Integer)
        Private _items As IEnumerable(Of Object)
        Private _chbClear As CheckBox
        Protected FlowLayoutPanel _pnlControlOptions
    
        Public ReadOnly Property Chart As FlexChart
            Get
                Return _chart
            End Get
        End Property
    
        Public ReadOnly Property IsFilterApplied As Boolean
            Get
                Return Not _chbClear.Checked
            End Get
        End Property
    
        Public Event SelectionChanged As EventHandler
    
        
    Public Sub FlexChartFilterView(ByVal items As IEnumerable(Of Object), ByVal bindingX As String, ByVal binding As String, ByVal Optional chartType As ChartType = ChartType.Column)
            InitializeComponent()
            _selectedIndices = New List(Of Integer)()
            Me._items = items
            _chart = New FlexChart() With {
                .ChartType = chartType,
                .DataSource = items,
                .BindingX = bindingX,
                .Binding = binding,
                .BackColor = Color.White,
                .Dock = DockStyle.Fill,
                .Margin = New Padding(0, 30, 0, 0)
            }
            Dim ser = New Series()
            Me.Chart.Series.Add(ser)
            Me.Chart.SelectionStyle.Stroke = Brushes.DarkBlue
            Me.Chart.SelectionStyle.StrokeWidth = 2
            Me.Chart.SelectionStyle.Fill = New SolidBrush(Color.FromArgb(200, Color.CornflowerBlue))
            Me.Chart.ToolTip.Content = "X: {x} " & vbLf & "Y: {y}"
            Me.Chart.AxisX.LabelMax = CSharpImpl.__Assign(Me.Chart.AxisX.LabelMin, True)
            Me.Chart.MouseClick += OnChartMouseClick
            ser.SymbolRendering += OnSeriesSymbolRendering
            _pnlControlOptions = New FlowLayoutPanel() With {
                .FlowDirection = FlowDirection.LeftToRight,
                .Dock = DockStyle.Top,
                .Height = 30,
                .AutoScroll = True
            }
            _chbClear = New CheckBox() With {
                .Text = "Clear",
                .Checked = True,
                .Enabled = False,
                .AutoSize = True
            }
            _chbClear.CheckedChanged += Function(s, e) OnClearChanged()
            _pnlControlOptions.Controls.Add(_chbClear)
            Controls.Add(_pnlControlOptions)
            Controls.Add(Chart)
        End Sub
    
    private List <int> _selectedIndices;
    private IEnumerable <object> _items;
    private CheckBox _chbClear;
    protected FlowLayoutPanel _pnlControlOptions;
    
    public FlexChart Chart {
     get {
      return _chart;
     }
    }
    public bool IsFilterApplied {
     get {
      return !_chbClear.Checked;
     }
    }
    
    public event EventHandler SelectionChanged;
    
    public FlexChartFilterView(IEnumerable>object< items,
                string bindingX,
                string binding,
                ChartType chartType = ChartType.Column)
    {
                InitializeComponent();
                _selectedIndices = new List>int<();
                this._items = items;
    
                //チャートを初期化します
                _chart = new FlexChart()
                {
                    ChartType = chartType,
                    DataSource = items,
                    BindingX = bindingX,
                    Binding = binding,
                    BackColor = Color.White,
                    Dock = DockStyle.Fill,
                    Margin = new Padding(0, 30, 0, 0)
                };
    
                var ser = new Series();
                this.Chart.Series.Add(ser);
    
                this.Chart.SelectionStyle.Stroke = Brushes.DarkBlue;
                this.Chart.SelectionStyle.StrokeWidth = 2;
                this.Chart.SelectionStyle.Fill = new SolidBrush(Color.FromArgb(200, Color.CornflowerBlue));
                this.Chart.ToolTip.Content = "X: {x} \nY: {y}";
                this.Chart.AxisX.LabelMax = this.Chart.AxisX.LabelMin = true;
    
                //チャートのMouseClickイベントを処理し、選択/フィルター済みアイテムを更新します
                this.Chart.MouseClick += OnChartMouseClick;
                //SelectionStyleでSelected/Filteredアイテム(データポイント)をレンダリングするための系列のSymbolRenderingイベントを処理します
                ser.SymbolRendering += OnSeriesSymbolRendering;
    
                _pnlControlOptions = new FlowLayoutPanel()
                {
                    FlowDirection = FlowDirection.LeftToRight,
                    Dock = DockStyle.Top,
                    Height = 30,
                    AutoScroll = true,
                };
    
                _chbClear = new CheckBox()
                {
                    Text = "Clear",
                    Checked = true,
                    Enabled = false,
                    AutoSize = true,
                };
                _chbClear.CheckedChanged += (s, e) =< OnClearChanged();
                _pnlControlOptions.Controls.Add(_chbClear);
    
                Controls.Add(_pnlControlOptions);
                Controls.Add(Chart);
    }
    
  2. Use the MouseClick event on FlexChart for allowing user to filter the rendered data by the clicked items, i.e, data-points.
    Private Sub OnChartMouseClick(ByVal sender As Object, ByVal e As MouseEventArgs)
        Dim hitTest = Chart.HitTest(e.Location)
    
        If hitTest.Item IsNot Nothing AndAlso hitTest.Distance = 0 Then
            Dim currentSelected = hitTest.PointIndex
    
            If Not _selectedIndices.Contains(currentSelected) Then
                _selectedIndices.Add(currentSelected)
            Else
                _selectedIndices.Remove(currentSelected)
            End If
    
            OnSelectedPointsChanged()
        End If
    End Sub
    
    private void OnChartMouseClick(object sender, MouseEventArgs e) {
     //クリックの場所でアイテム/データポイントを確認し、それに応じて選択を変更します
     var hitTest = Chart.HitTest(e.Location);
     if (hitTest.Item != null && hitTest.Distance == 0) {
      var currentSelected = hitTest.PointIndex;
      if (!_selectedIndices.Contains(currentSelected))
       _selectedIndices.Add(currentSelected);
      else
       _selectedIndices.Remove(currentSelected);
      OnSelectedPointsChanged();
     }
    }
    
  3. Use SymbolRendering event on the series for rendering the selected or filtered items as highlighted.
    Private Sub OnSeriesSymbolRendering(ByVal sender As Object, ByVal e As RenderSymbolEventArgs)
        If _selectedIndices.Contains(e.Index) Then
            If Chart.SelectionStyle.Stroke IsNot Nothing Then e.Engine.SetStroke(Chart.SelectionStyle.Stroke)
            If Chart.SelectionStyle.StrokeWidth > 0 Then e.Engine.SetStrokeThickness(Chart.SelectionStyle.StrokeWidth)
            If Chart.SelectionStyle.Fill IsNot Nothing Then e.Engine.SetFill(Chart.SelectionStyle.Fill)
        End If
    End Sub
    
    private void OnSeriesSymbolRendering(object sender, RenderSymbolEventArgs e) {
     if (_selectedIndices.Contains(e.Index)) {
      if (Chart.SelectionStyle.Stroke != null)
       e.Engine.SetStroke(Chart.SelectionStyle.Stroke);
      if (Chart.SelectionStyle.StrokeWidth > 0)
       e.Engine.SetStrokeThickness(Chart.SelectionStyle.StrokeWidth);
      if (Chart.SelectionStyle.Fill != null)
       e.Engine.SetFill(Chart.SelectionStyle.Fill);
     }
    }
    
  4. Raise the SelectionChanged event on this view whenever selected or filtered items change.
    Private Sub OnSelectedPointsChanged()
        _chbClear.Checked = If(_selectedIndices.Count = 0, True, False)
        Chart.Refresh()
        RaiseEvent SelectionChanged(Me, Nothing)
    End Sub
    
    private void OnSelectedPointsChanged() {
     _chbClear.Checked = _selectedIndices.Count == 0 ? true : false;
     Chart.Refresh();
     if (SelectionChanged != null)
      SelectionChanged(this, null);
    }
    
Back to Top

Step 3: Create a Custom Filter

  1. Create a class named FlexChartFilter, inheriting CustomFilter class, to be used as a custom filter, initialize FlexChartFilterView and use a control for FlexChartFilter.
    Public Sub New(ByVal items As IEnumerable(Of Object), ByVal xProperty As String, ByVal yProperty As String, ByVal Optional chartType As ChartType = ChartType.Column, ByVal Optional filterUsingXY As Boolean = False)
            filterView = New FlexChartFilterView(items, xProperty, yProperty, chartType) With {
                .Height = 250
            }
            Control = filterView
            propertyX = xProperty
            propertyY = yProperty
            Me.filterUsingXY = filterUsingXY
        End Sub
    
    public FlexChartFilter(IEnumerable <object> items, string xProperty, string yProperty, ChartType chartType = ChartType.Column, bool filterUsingXY = false) {
     //このフィルターのUIを提供するFlexChartFilterViewインスタンスを作成します
     filterView = new FlexChartFilterView(items, xProperty, yProperty, chartType) {
      Height = 250
     };
    
     //FlexChartFilterViewをフィルタリングに使用するコントロールとして設定します
     Control = filterView;
    
     propertyX = xProperty;
     propertyY = yProperty;
     this.filterUsingXY = filterUsingXY;
    }
    
  2. Subscribe the SelectionChanged event on the view to create/update the FilterExpression.
    //選択したアイテムが変更されたときに新しいフィルター式を作成するためのフィルタービューでSelectionChangedイベントを処理します
    filterView.SelectionChanged += Function(s, e) OnValueChanged()
    
    //選択したアイテムが変更されたときに新しいフィルター式を作成するために、フィルタービューでSelectionChangedイベントを処理します
    filterView.SelectionChanged += (s, e) => OnValueChanged();
    
  3. Use the selected items provided by the view for creating the FilterExpression.

    Class SurroundingClass
        Protected Overrides Function GetExpression() As Expression
            Dim selectedItems = filterView.GetSelectedValues()
            Return CreateExpression(selectedItems)
        End Function
    
        Public Overrides ReadOnly Property IsApplied As Boolean
            Get
                Return filterView.IsFilterApplied
            End Get
        End Property
    
        Private Function CreateExpression(ByVal selectedItems As IEnumerable(Of Object)) As Expression
            Dim exp As CombinationExpression = New CombinationExpression()
            exp.FilterCombination = C1.CollectionView.FilterCombination.[Or]
    
            For Each item In selectedItems
                Dim comboExp = New CombinationExpression() With {
                    .FilterCombination = C1.CollectionView.FilterCombination.[And]
                }
                comboExp.Expressions.Add(New OperationExpression With {
                    .PropertyName = propertyX,
                    .Value = GetPropertyValue(propertyX, item),
                    .FilterOperation = C1.CollectionView.FilterOperation.Equal
                })
    
                If filterUsingXY Then
    
                    For Each [property] In propertyY.Split(","c)
                        comboExp.Expressions.Add(New OperationExpression With {
                            .PropertyName = [property].Trim(),
                            .Value = GetPropertyValue([property].Trim(), item),
                            .FilterOperation = C1.CollectionView.FilterOperation.Equal
                        })
                    Next
                End If
    
                exp.Expressions.Add(comboExp)
            Next
    
            Return exp
        End Function
    
        Protected Function GetPropertyValue(ByVal name As String, ByVal obj As Object) As Object
            Dim propInfo = obj.[GetType]().GetProperty(name)
            Return propInfo.GetValue(obj)
        End Function
    End Class
    
    protected override Expression GetExpression() {
     var selectedItems = filterView.GetSelectedValues();
     return CreateExpression(selectedItems);
    }
    
    public override bool IsApplied {
     get {
      return filterView.IsFilterApplied;
     }
    }
    
    private Expression CreateExpression(IEnumerable < object > selectedItems) {
     CombinationExpression exp = new CombinationExpression();
     exp.FilterCombination = C1.CollectionView.FilterCombination.Or;
    
     //選択した各アイテムの式を作成します
     foreach(var item in selectedItems) {
      var comboExp = new CombinationExpression() {
       FilterCombination = C1.CollectionView.FilterCombination.And
      };
      //X-Valueに一致する式。
      comboExp.Expressions.Add(new OperationExpression {
       PropertyName = propertyX,
        Value = GetPropertyValue(propertyX, item),
        FilterOperation = C1.CollectionView.FilterOperation.Equal,
      });
      if (filterUsingXY) {
       //対応するY値に一致する式
       foreach(var property in propertyY.Split(',')) {
        comboExp.Expressions.Add(new OperationExpression {
         PropertyName = property.Trim(),
          Value = GetPropertyValue(property.Trim(), item),
          FilterOperation = C1.CollectionView.FilterOperation.Equal,
        });
       }
      }
      exp.Expressions.Add(comboExp);
     }
     return exp;
    }
    protected object GetPropertyValue(string name, object obj) {
     var propInfo = obj.GetType().GetProperty(name);
     return propInfo.GetValue(obj);
    }
    
Back to Top

Step 4: Use the Custom Filter with DataFilter

  1. Bind the FlexGrid control to a data source and update data source when filter condition or expression gets changed.
    Private salesData As ObservableCollection(Of Sales)
    
    Private Sub Form1_Load(ByVal sender As Object, ByVal e As EventArgs)
        salesData = New ObservableCollection(Of Sales)(DataService.GetSalesData(500))
            
            'FlexGridの設定
        c1FlexGrid1.DataSourceChanged += AddressOf C1FlexGrid1_DataSourceChanged
        c1FlexGrid1.DataSource = salesData
            
            'DataFilterのソースを設定します
        c1DataFilter1.DataSource = salesData
        c1DataFilter1.FilterChanged += Function(s, args)
            'フィルター条件/式に変更があるたびにFlexGridのデータソースをリセットします
        c1FlexGrid1.DataSource = c1DataFilter1.View.ToList()
     End Function
    End Sub
    
    Private Sub C1FlexGrid1_DataSourceChanged(ByVal sender As Object, ByVal e As EventArgs)
        For i As Integer = 1 To c1FlexGrid1.Cols.Count - 1
            c1FlexGrid1.Cols(i).StarWidth = "*"
        Next
    End Sub
    
    private ObservableCollection <Sales> salesData;
    
    private void Form1_Load(object sender, EventArgs e) {
     salesData = new ObservableCollection <Sales> (DataService.GetSalesData(500));
     
     //FlexGridの設定
     c1FlexGrid1.DataSourceChanged += C1FlexGrid1_DataSourceChanged;
     c1FlexGrid1.DataSource = salesData;
            
    //DataFilterのソースを設定します
    c1DataFilter1.DataSource = salesData;
    c1DataFilter1.FilterChanged += (s, args) =>
    {
     //フィルター条件/式に変更があるたびにFlexGridのデータソースをリセットします
     c1FlexGrid1.DataSource = c1DataFilter1.View.ToList();
    };
    }
            
    private void C1FlexGrid1_DataSourceChanged(object sender, EventArgs e) {
     for (int i = 1; i < c1FlexGrid1.Cols.Count; i++)
      c1FlexGrid1.Cols[i].StarWidth = "*";
    }
    
  2. Set the AutoGenerateFilters property of DataFilter to false in the Form Load event handler for using custom filters.
    c1DataFilter1.AutoGenerateFilters = false
    
    c1DataFilter1.AutoGenerateFilters = false;
    
  3. Create an instance of the FlexChartFilter and add it to the Filters collection of DataFilter.
    'カスタムフィルターの初期化:FlexChartFilterを作成し、DataFilterのFiltersコレクションに追加します
    Dim categoryWiseSales = salesData.GroupBy(Function(s) s.Category).[Select](Function(grp) New With {Key
            .Category = grp.Key, Key
            .Amount = grp.Sum(Function(item) item.Amount)
        })
        Dim categoryFilter = New FlexChartFilter(categoryWiseSales, "Category", "Amount")
        categoryFilter.HeaderText = "Category-wise Sales"
        categoryFilter.FlexChart.AxisX.LabelAngle = 45
        c1DataFilter1.Filters.Add(categoryFilter)
    
    //カスタムフィルターの初期化:FlexChartFilterを作成し、DataFilterのFiltersコレクションに追加します
    var categoryWiseSales = salesData.GroupBy(s => s.Category).Select(grp => new {
     Category = grp.Key, Amount = grp.Sum(item => item.Amount)});
    var categoryFilter = new FlexChartFilter(categoryWiseSales, "Category", "Amount");
    categoryFilter.HeaderText = "Category-wise Sales";
    categoryFilter.FlexChart.AxisX.LabelAngle = 45;
    c1DataFilter1.Filters.Add(categoryFilter);
    

Run the application and observe how the data appearing in FlexGrid gets filtered based on the categories selected from the custom filter used in the DataFilter control.
Now, you can change the filter values in the DataFilter UI and see how the FlexGrid renders the filtered data.

Back to Top