FlexChart では、プロパティグリッドやコレクションエディタなどを使用して、Visual Studio で設計時に簡単にチャートを構成できます。チャート軸の構成、チャートタイプの設定、データソースの構築、アニメーションの適用、外観のカスタマイズなど、多数のオプションをプロパティグリッドから利用できます。プロパティグリッドのほかに、FlexChart にはコーディングタスクをさらに容易にする次のコレクションエディタが用意されています。
Smart Tag Panel
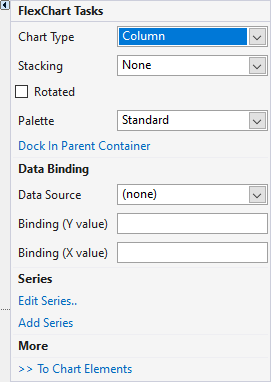
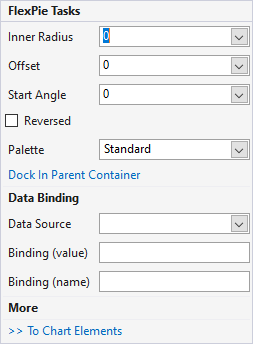
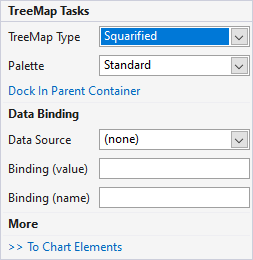
Smart tags provide quick and easy access to common properties in the design time. The smart tag panel for charts can be accessed by the smart tag ( ![]() ) on the upper right corner of the control. It can also be accessed directly by clicking any specific element of the chart such as axis, legend, series, etc. The tables below describe smart tag panels available in various charts.
) on the upper right corner of the control. It can also be accessed directly by clicking any specific element of the chart such as axis, legend, series, etc. The tables below describe smart tag panels available in various charts.
FlexChart Add Series Smart Tag Panel
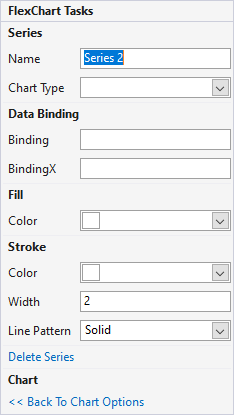
The Add Series Tasks smart tag panel is similar in both FlexChart and FlexRadar. It provides easy access to the commonly used properties of series. To access this smart tag panel, click on the series in the chart area or click on the Add Series option from the FlexChart or FlexRadar Tasks Smart Tag Panel.
|
|
Option | Description |
| Name | Set the name of the series. This series name also reflects on the Legend in the FlexChart. | |
| Chart Type | Choose from extensive collection of chart types from the dropdown list. | |
| Binding | Choose the name of the property that contains Y axis values for the series. | |
| BindingX | Choose the name of the property that contains X axis values for the series. | |
| Color (Fill) | Choose the Fill Color for the series. | |
| Color (Stroke) | Choose the color for the Line of the series | |
| Width | Choose the Width for the line of the series | |
| Line Pattern | Choose the pattern for the line of the series from the dropdown list. By default, it is set as Solid. | |
| Delete Series | Select this to delete the series from the FlexChart. | |
| Back To Chart Options | Select this option to go back to the FlexChart smart tag panel. | |
FlexChart Legend Smart Tag Panel
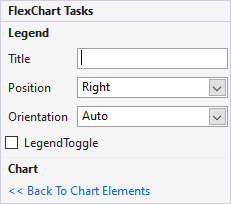
Legend related task panel can be accessed by clicking Legend on the FlexChart or by clicking “To Chart Elements” on the FlexChart Tasks smart tag panel and choosing the Legend option. The same list of options are available for FlexPie, Sunburst, FlexRadar, and TreeMap as well.
|
|
Option | Description |
| Title | Set the Title property for the Legend. | |
| Position | Set the Position of the Legend from the available options in the dropdown list. By default, it is Right. | |
| Orientation | Set the Orientation of the Legend from the available options in the dropdown list. By default, it is Auto. | |
| Legend Toggle | Toggle the visibility of the data series on FlexChart during runtime with this option. By default, the toggle option is disabled. | |
| Back To Chart Elements | Select this option to go back to the FlexChart smart tag panel. | |
FlexChart Axis Smart Tag Panel
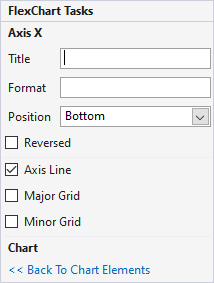
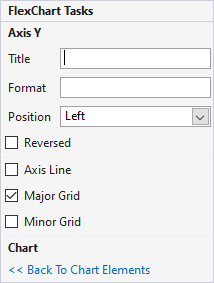
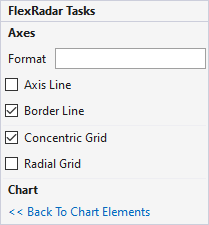
Axis related task panel is similar for both FlexChart and FlexRadar. It can be accessed by clicking “To Chart Elements” on the FlexChart and FlexRadar Tasks smart tag panel and accessing Axis options or by clicking Axis on the FlexChart and FlexRadar.
FlexChart Header/Footer Smart Tag Panel
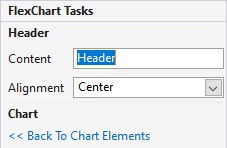
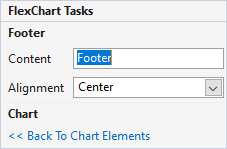
You can add header or footer for the chart using Add Header/ Add Footer option. This option can be accessed by clicking "To Chart Elements" from the FlexChart Tasks smart tag panel. The same task panel is also available in FlexPie, Sunburst, FlexRadar, and TreeMap as well.
  |
Option | Description |
| Content | Set the value for Header/Footer of the FlexChart. | |
| Alignment | Set the position of the Header or Footer from the options available in the dropdown list. | |
| Back To Chart Elements | Select this option to go back to the FlexChart smart tag panel. | |
FlexChart Data Label Smart Tag Panel
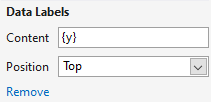
Data Labels can be added by using Add option under Data Labels. This option can be accessed by clicking "To Chart Elements" from the FlexChart Tasks smart tag panel. The same task panel is also available in FlexPie, Sunburst, FlexRadar, and TreeMap as well.
|
|
Option | Description |
| Content | Set the value to Data Labels. The value can be either X or Y that represent respective Axes and must be enclosed within { }. | |
| Position | Set the Position of the Data Label on the Series of the FlexChart from the available options in the dropdown list. | |
| Remove | Choose this option to remove the applied Data Labels from the FlexChart. | |
Series Collection Editor
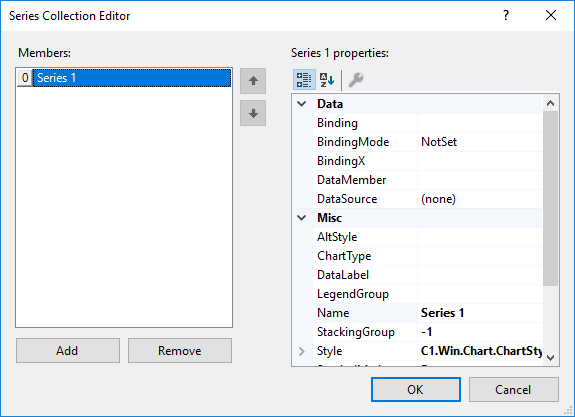
Series Collection Editor of FlexChart can be used to add the series and set the related properties at design-time. You can set the data source, chart type, tooltip, visibility etc. of each series using this collection editor. Following are the steps to access the same:
- Right-click the FlexChart or FlexRadar control on form.
- Select Properties from the context menu.
- In the Properties window, click the ellipsis button next to the Series property.
