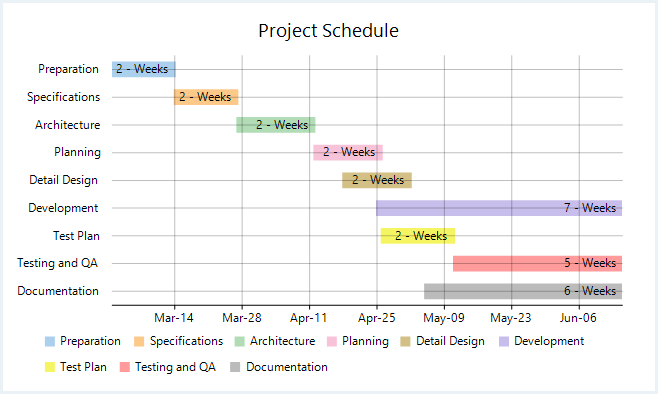
ガントチャートは、プロジェクトの活動を時間軸に沿ってプロットすることでプロジェクトのスケジュールと計画を表示するチャートです。このチャートでは、活動を Y 軸に、時間スケールを X 軸に並べ、活動の開始時刻から始まるように置かれた横棒の長さで各活動の期間を示します。ガントチャートの主な目的は計画立案とスケジュール策定なので、建設、エンジニアリング、製造、インフラ、IT などの各種業界の多様なプロジェクトで使用されます。
FlexChart では、Series クラスを使用して WinForms ガントチャートを実装できます。初めに、新しい Series オブジェクトを作成し、そのプロパティを指定します。次に、Series クラスから提供される SymbolRendering イベントを使用してアクティビティバーをチャートにプロットし、FlexChart クラスから提供される LabelRendering イベントを使用してラベルを表示します。
private void Form1_Load(object sender, EventArgs e)
{
    this.flexChart1.ChartType = ChartType.Bar;
    this.flexChart1.BindingX = "Name";

    Series series = new GanttSeriesWithPointLegendItems() { Binding = "End" };
    series.SymbolRendering += Series_SymbolRendering;
    this.flexChart1.Series.Add(series);

    this.flexChart1.DataLabel.Content = "{DurationInWeeks} - Weeks";
    this.flexChart1.DataLabel.Position = LabelPosition.Left;
    this.flexChart1.DataSource = taskData = GetTasksData();
    this.flexChart1.AxisX.Min = taskData[taskData.Count - 1].Start.ToOADate();
    this.flexChart1.AxisX.MajorGrid = true;
    this.flexChart1.AxisX.MajorUnit = 14D;
    this.flexChart1.AxisX.Format = "MMM-dd";
    this.flexChart1.Header.Content = "Project Schedule";
}
public class GanttSeriesWithPointLegendItems : Series, ISeries
{
    string ISeries.GetLegendItemName(int index) { return taskData.ElementAt(taskData.Count - 1 - index).Name; }
    _Style ISeries.GetLegendItemStyle(int index)
    {
        return new _Style { Fill = new SolidBrush(colors[(index) % colors.Length]) };
    }
    int ISeries.GetLegendItemLength() { return taskData.Count; }
}
private void Series_SymbolRendering(object sender, RenderSymbolEventArgs e)
{
    e.Cancel = true;
    Task task = (Task)e.Item;
    var height = this.flexChart1.PlotRect.Height / ((List<Task>)this.flexChart1.DataSource).Count / 2;
    var start = this.flexChart1.AxisX.Convert(task.Start.ToOADate());
    e.Engine.SetFill(new SolidBrush(colors[(taskData.Count - 1 - e.Index) % colors.Length]));
    e.Engine.SetStroke(new SolidBrush(colors[(taskData.Count - 1 - e.Index) % colors.Length]));
    e.Engine.DrawRect(start, e.Point.Y - height / 2, e.Point.X - start, height);
}
Private Sub Form1_Load(sender As Object, e As EventArgs)
    Me.flexChart1.ChartType = ChartType.Bar
    Me.flexChart1.BindingX = "Name"

    Dim series As Series = New GanttSeriesWithPointLegendItems() With {
          .Binding = "End"
    }
    AddHandler series.SymbolRendering, AddressOf Series_SymbolRendering
    Me.flexChart1.Series.Add(series)

    Me.flexChart1.DataLabel.Content = "{DurationInWeeks} - Weeks"
    Me.flexChart1.DataLabel.Position = LabelPosition.Left
    Me.flexChart1.DataSource = InlineAssignHelper(taskData, GetTasksData())
    Me.flexChart1.AxisX.Min = taskData(taskData.Count - 1).Start.ToOADate()
    Me.flexChart1.AxisX.MajorGrid = True
    Me.flexChart1.AxisX.MajorUnit = 14.0
    Me.flexChart1.AxisX.Format = "MMM-dd"
    Me.flexChart1.Header.Content = "Project Schedule"
End Sub
Public Class GanttSeriesWithPointLegendItems
    Inherits Series
    Implements ISeries
    Private Function ISeries_GetLegendItemName(index As Integer) As String Implements ISeries.GetLegendItemName
        Return taskData.ElementAt(taskData.Count - 1 - index).Name
    End Function
    Private Function ISeries_GetLegendItemStyle(index As Integer) As _Style Implements ISeries.GetLegendItemStyle
        Return New _Style() With {
              .Fill = New SolidBrush(colors((index) Mod colors.Length))
        }
    End Function
    Private Function ISeries_GetLegendItemLength() As Integer Implements ISeries.GetLegendItemLength
        Return taskData.Count
    End Function
End Class
Private Sub Series_SymbolRendering(sender As Object, e As RenderSymbolEventArgs)
    e.Cancel = True
    Dim task As Task = DirectCast(e.Item, Task)
    Dim height As Single = Me.flexChart1.PlotRect.Height / DirectCast(Me.flexChart1.DataSource, List(Of Task)).Count / 2
    Dim start As Double = Me.flexChart1.AxisX.Convert(task.Start.ToOADate())
    e.Engine.SetFill(New SolidBrush(colors((taskData.Count - 1 - e.Index) Mod colors.Length)))
    e.Engine.SetStroke(New SolidBrush(colors((taskData.Count - 1 - e.Index) Mod colors.Length)))
    e.Engine.DrawRect(start, e.Point.Y - height / 2, e.Point.X - start, height)
End Sub
上記のサンプルコードは、GetTasksData という名前のカスタムメソッドを使用してチャートにデータを提供しています。要件に基づいてデータソースを設定できます。
public static List<Task> GetTasksData()
{
    var taskList = new List<Task>();
    var year = DateTime.Now.Year;
    taskList.Add(new Task { Name = "Documentation", Start = new DateTime(year, 5, 5), End = new DateTime(year, 6, 15) });
    taskList.Add(new Task { Name = "Testing and QA", Start = new DateTime(year, 5, 11), End = new DateTime(year, 6, 15) });
    taskList.Add(new Task { Name = "Test Plan", Start = new DateTime(year, 4, 26), End = new DateTime(year, 5, 11) });
    taskList.Add(new Task { Name = "Development", Start = new DateTime(year, 4, 25), End = new DateTime(year, 6, 15) });
    taskList.Add(new Task { Name = "Detail Design", Start = new DateTime(year, 4, 18), End = new DateTime(year, 5, 2) });
    taskList.Add(new Task { Name = "Planning", Start = new DateTime(year, 4, 12), End = new DateTime(year, 4, 26) });
    taskList.Add(new Task { Name = "Architecture", Start = new DateTime(year, 3, 27), End = new DateTime(year, 4, 12) });
    taskList.Add(new Task { Name = "Specifications", Start = new DateTime(year, 3, 14), End = new DateTime(year, 3, 27) });
    taskList.Add(new Task { Name = "Preparation", Start = new DateTime(year, 3, 1), End = new DateTime(year, 3, 14) });

    return taskList;
}
Public Shared Function GetTasksData() As List(Of Task)
    Dim taskList As List(Of Task) = New List(Of Task)()
    Dim year As Integer = DateTime.Now.Year
    taskList.Add(New Task() With {
          .Name = "Documentation",
          .Start = New DateTime(year, 5, 5),
          .[End] = New DateTime(year, 6, 15)
    })
    taskList.Add(New Task() With {
          .Name = "Testing and QA",
          .Start = New DateTime(year, 5, 11),
          .[End] = New DateTime(year, 6, 15)
    })
    taskList.Add(New Task() With {
          .Name = "Test Plan",
          .Start = New DateTime(year, 4, 26),
          .[End] = New DateTime(year, 5, 11)
    })
    taskList.Add(New Task() With {
          .Name = "Development",
          .Start = New DateTime(year, 4, 25),
          .[End] = New DateTime(year, 6, 15)
    })
    taskList.Add(New Task() With {
          .Name = "Detail Design",
          .Start = New DateTime(year, 4, 18),
          .[End] = New DateTime(year, 5, 2)
    })
    taskList.Add(New Task() With {
          .Name = "Planning",
          .Start = New DateTime(year, 4, 12),
          .[End] = New DateTime(year, 4, 26)
    })
    taskList.Add(New Task() With {
          .Name = "Architecture",
          .Start = New DateTime(year, 3, 27),
          .[End] = New DateTime(year, 4, 12)
    })
    taskList.Add(New Task() With {
          .Name = "Specifications",
          .Start = New DateTime(year, 3, 14),
          .[End] = New DateTime(year, 3, 27)
    })
    taskList.Add(New Task() With {
          .Name = "Preparation",
          .Start = New DateTime(year, 3, 1),
         .[End] = New DateTime(year, 3, 14)
    })

    Return taskList
End Function