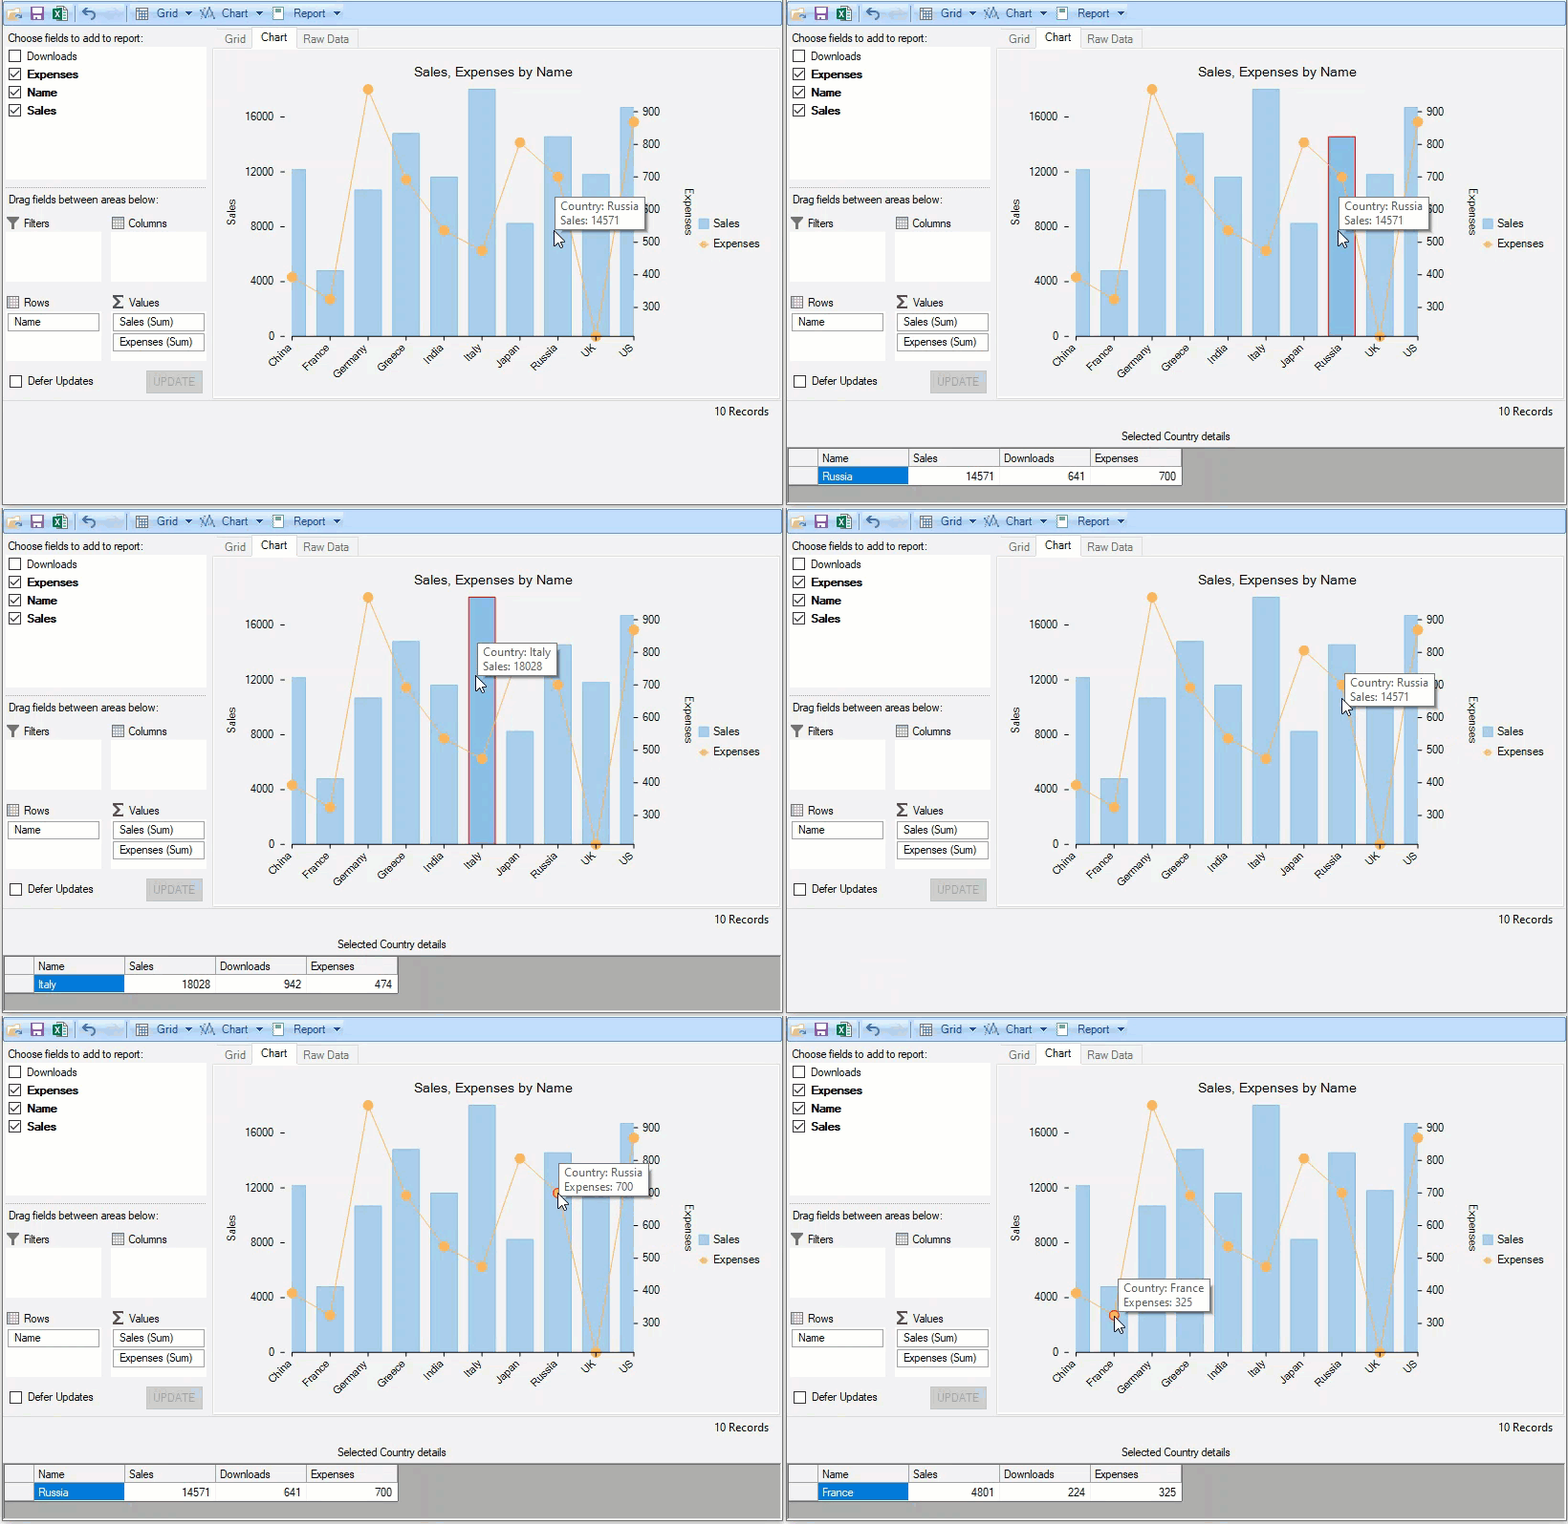
The new FlexPivotChart control lets you use the FlexChart control within C1FlexPivot for impeccable data analysis. In this walkthrough, we utilize a scenario where a user wants to analyze the sales and expense data of products across different countries. The FlexPivotPage and FlexPivotChart classes are used in this application along with FlexChart and FlexGrid controls to produce the desired visual data analysis.
With the help of this walkthrough, you will learn how to:
- Show multiple Series and secondary axis in FlexPivotChart element.
- Modify tooltips for FlexPivotChart element.
- Show details for selected data point in the FlexPivotChart using FlexGrid control.

Show multiple Series and secondary axis in FlexPivotChart element
Initialize the FlexPivotPage and FlexGrid controls.
| C# |
コードのコピー
|
|---|---|
// フォームを初期化します flexPivotPage = new FlexPivotPage(); flexPivotPage.Height = 440; flexPivotPage.Dock = DockStyle.Top; this.Controls.Add(flexPivotPage); lbl = new Label() { Text = "Selected Country details", TextAlign = ContentAlignment.MiddleCenter, Dock = DockStyle.Bottom, Visible =false }; this.Controls.Add(lbl); detailGrid = new C1FlexGrid(); detailGrid.Dock = DockStyle.Bottom; detailGrid.Height = 60; detailGrid.Visible = false; this.Controls.Add(detailGrid); selectedCountryData = new ObservableCollection<Country>(); detailGrid.DataSource = selectedCountryData; |
|
Add Data Source, RowFields and ValueFields to the FlexPivotPage control. Set the Chart type for FlexPivotChart control and get the series collection for FlexChart control.
| C# |
コードのコピー
|
|---|---|
// FlexPivot DataSourceおよびその他のフィールドを設定します flexPivotPage.DataSource = GetCountrySales(); flexPivotPage.PivotEngine.ValueFields.Add("Sales"); flexPivotPage.PivotEngine.ValueFields.Add("Expenses"); flexPivotPage.PivotEngine.RowFields.Add("Name"); // チャートの系列、ツールチップ、およびデータポイントの詳細を処理するためのFlexPivotChart設定を定義します // FlexPivotChartタイプを設定します flexPivotPage.FlexPivotChart.ChartType = ChartType.Line; // 系列を上/横に配置するかどうかを設定します flexPivotPage.FlexPivotChart.Stacked = false; // FlexPivotの新しいAPI FlexPivotChartからFlexChartコンポーネントを取得します var flexChart = flexPivotPage.FlexPivotChart.Chart as FlexChart; if(flexChart!=null) { // FlexChartのSeriesコレクションを取得します var seriesColl = flexChart.Series as ObservableCollection<Series>; seriesColl.CollectionChanged += SeriesColl_CollectionChanged; } // データポイントの関連詳細を取得できる用に、FlexChartでデータポイントの選択を有効にします flexChart.SelectionMode = C1.Chart.ChartSelectionMode.Point; flexChart.SelectionChanged += FlexChart_SelectionChanged; // FlexChartのマウス移動イベントを処理して、そのツールヒントを変更します flexChart.MouseMove += Chart_MouseMove; |
|
In this walkthrough, we have added two series of charts, 'Sales' and 'Expenses'. The Sales series is a Column chart type and the Expenses series is Line chart type. There are two axes in this series collection, one plotted across the left and the other towards the right. A secondary chart axis is useful when the user wants to show the values for more than one data series. The secondary axis is apt in this scenario as we have used a combination of column and line charts.
| C# |
コードのコピー
|
|---|---|
// 個々のFlexChart系列を変更します private void SeriesColl_CollectionChanged(object sender, System.Collections.Specialized.NotifyCollectionChangedEventArgs e) { // 系列がFlexChartに追加された場合のみ処理します if (e.Action== System.Collections.Specialized.NotifyCollectionChangedAction.Add) { var series = e.NewItems[e.NewItems.Count - 1] as Series; if (series == null) return; switch(series.Name) { case "Sales": series.ChartType = C1.Chart.ChartType.Column; series.AxisY = new Axis() { AxisLine = false, Position = C1.Chart.Position.Left, Title = "Sales" }; break; case "Expenses": series.ChartType = C1.Chart.ChartType.LineSymbols; series.AxisY = new Axis() { AxisLine = false, Position = C1.Chart.Position.Right, Title = "Expenses" }; break; } } else { // FlexPivotPageを除くすべてのコントロールを非表示にします detailGrid.Visible = false; lbl.Visible = false; } } |
|
Modify tooltips for FlexPivotChart element
If a user wants to show information about country-specific sales or expenses, it can be set using the ToolTip property of the FlexChartBase class, which provides information about the 'Country' (AxisX label) and data specific to the series 'Sales' or 'Expenses'. The information about a specific data point on a Series chart is provided using the HitTest method of FlexChart class.
| C# |
コードのコピー
|
|---|---|
// FlexChartのツールチップを変更します private void Chart_MouseMove(object sender, MouseEventArgs e) { var chart = sender as FlexChart; // マウスポインターの下の要素を取得します var hitTestInfo = chart.HitTest(e.Location); if (hitTestInfo == null || hitTestInfo.Item == null) return; if (hitTestInfo.Item != null && hitTestInfo.Distance <= 3) { // マウスポインターに固有の国名(AxisXラベル)を取得します var country = ((List<string>)chart.AxisX.DataSource)[hitTestInfo.PointIndex]; // FlexChartツールチップの値/内容を変更します chart.ToolTip.Content = String.Format("Country: {0}\n{1}: {2}", country, hitTestInfo.Series.Name, hitTestInfo.Y); } } |
|
Show details for selected data point in the FlexPivotChart using FlexGrid control
In the application, the user can select a chart element, and get the details for the selected element in the FlexGrid. The ChartSelectionMode enumeration enables data point selection in FlexChart to get the associated details for each data point.
| C# |
コードのコピー
|
|---|---|
// 選択したFlexChart要素の詳細を取得します private void FlexChart_SelectionChanged(object sender, EventArgs e) { var chart = sender as FlexChart; if (chart != null && chart.SelectedIndex > -1) { // 選択した要素の詳細を表示するためのコントロールを有効にします detailGrid.Visible = true; lbl.Visible = true; // 選択した要素の詳細を取得します Country selectedCountry = (((chart.Parent as FlexPivotChart).DataSource as C1FlexPivotPanel).DataSource as List<Country>).OrderBy(c => c.Name).ToList()[chart.SelectedIndex] as Country; if(selectedCountry!=null) { selectedCountryData.Clear(); selectedCountryData.Add(selectedCountry); detailGrid.DataSource = selectedCountryData.ToList(); } } else { // FlexPivotPageを除くすべてのコントロールを非表示にします detailGrid.Visible = false; lbl.Visible = false; } } |
|