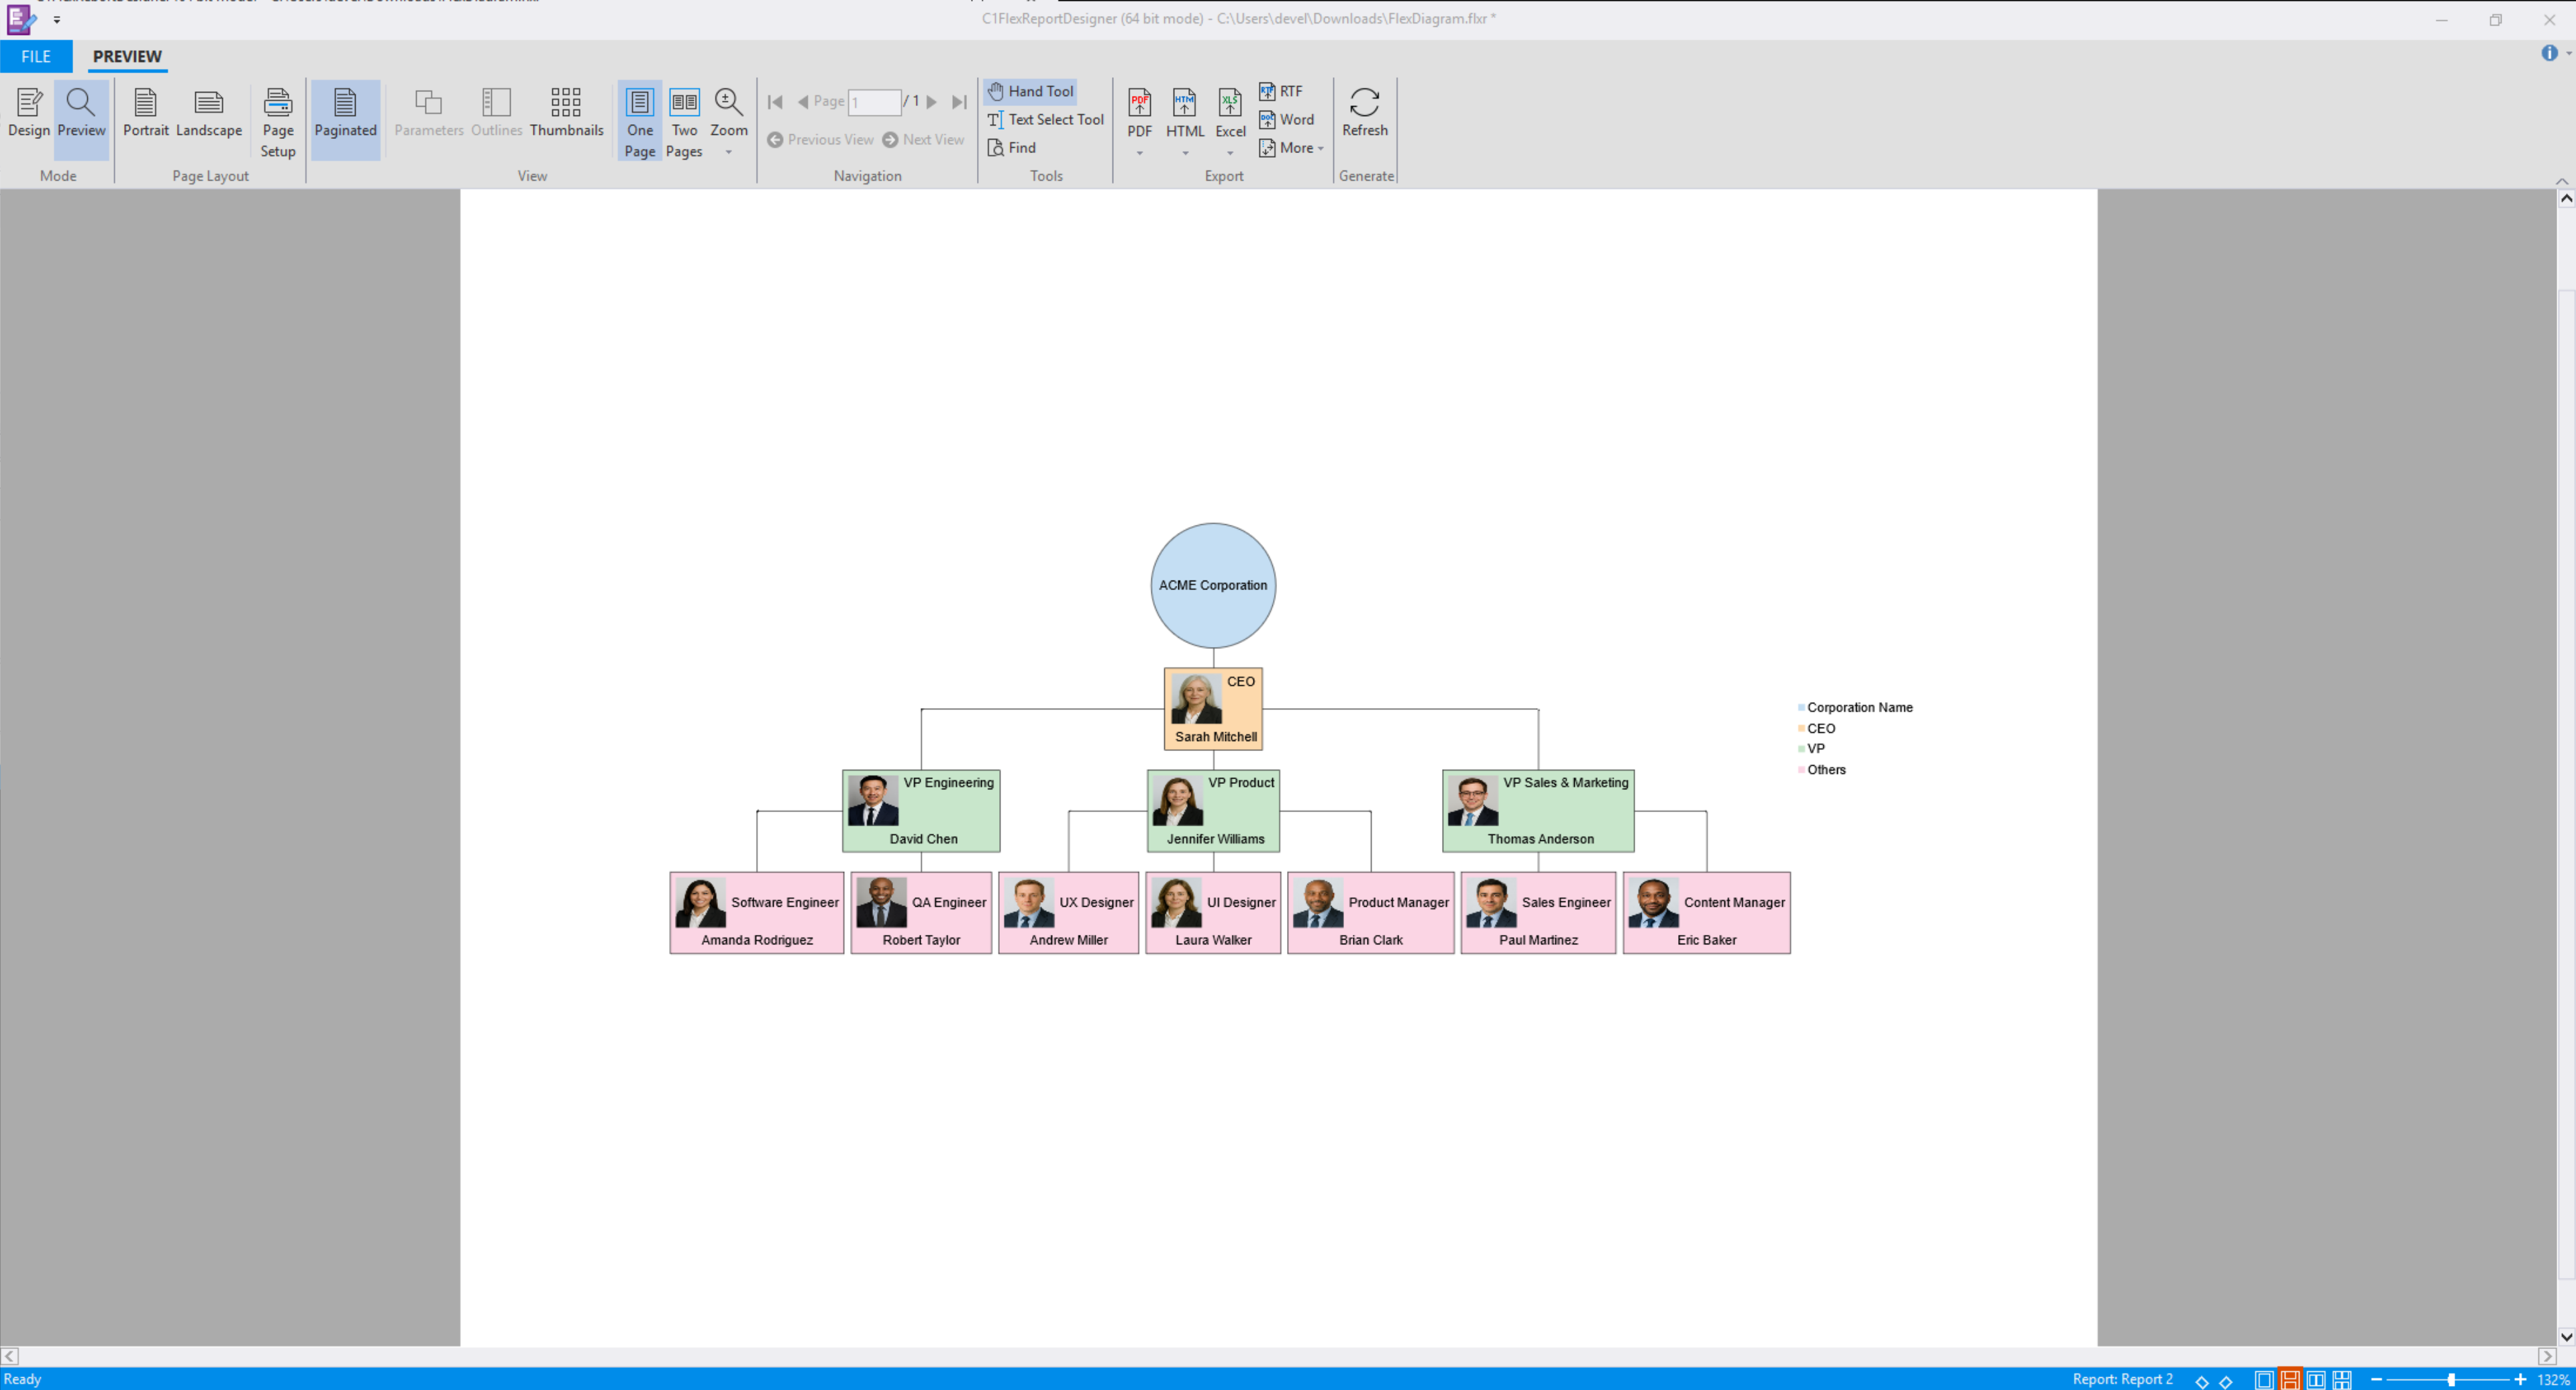
The DiagramChart field is a specialized report field used to visualize graph-based structures such as organizational charts and relationship diagrams. It supports both bound and unbound configurations, enabling flexible diagram creation based on a data source or manually defined elements.
The DiagramChart field supports the following scenarios:
- Rendering hierarchical or relational data from a data source (Bound Mode)
- Defining nodes and edges manually (Unbound Mode)
Bind a DiagramChart Field to Data (Bound Mode)
After adding a DiagramChart field to a report, the field can be bound to a data source to render structured data.
To bind a DiagramChart field to data:
- Create a new Microsoft Excel worksheet named OrgChart_Data.
- Add the following columns and populate them with data:
| Company | Department | Manager | Employee | JobTitle |
|---|---|---|---|---|
| Acme Corporation | Engineering | Amanda Rodriguez | John Smith | Senior Software Engineer |
| Acme Corporation | Engineering | Amanda Rodriguez | Lisa Wang | Software Engineer |
| Acme Corporation | Engineering | Amanda Rodriguez | Michael Brown | Software Engineer |
| Acme Corporation | Engineering | Robert Taylor | Emma Wilson | QA Engineer |
| Acme Corporation | Engineering | Robert Taylor | Chris Anderson | QA Engineer |
| Acme Corporation | Product | Andrew Miller | Nicole Harris | Product Manager |
| Acme Corporation | Product | Andrew Miller | Brian Clark | Product Manager |
| Acme Corporation | Product | Sophia Lewis | Mark Robinson | UX Designer |
| Acme Corporation | Product | Sophia Lewis | Laura Walker | UI Designer |
| Acme Corporation | Sales | Karen White | Paul Martinez | Account Executive |
| Acme Corporation | Sales | Karen White | Rebecca Young | Account Executive |
| Acme Corporation | Sales | Karen White | Frank Adams | Sales Engineer |
| Acme Corporation | Sales | Linda Campbell | Eric Baker | Content Manager |
| Acme Corporation | Sales | Linda Campbell | Hannah Collins | Marketing Specialist |
-
Save the Excel file.
-
Create a new report in FlexReportDesigner.
-
In the Data tab, bind the main data source to the OrgChart_Data table.
For detailed data-binding instructions, refer to the FlexReport QuickStart documentation.
- Configure the data link properties:
a. Open the All tab.
b. Locate Extended Properties.
c. Set the value to:
| C# |
コードのコピー
|
|---|---|
| Excel 12.0 Xml;HDR=YES;IMEX=1 | |
This setting specifies that the data source is an Excel file with column headers in the first row.
-
On the Insert tab, add the DiagramChart field to the report header section.
-
Select the DiagramChart field on the design surface.
-
In the Properties window:
a. Set
DataSourceNameto:Main
b. Set
Bindingto:
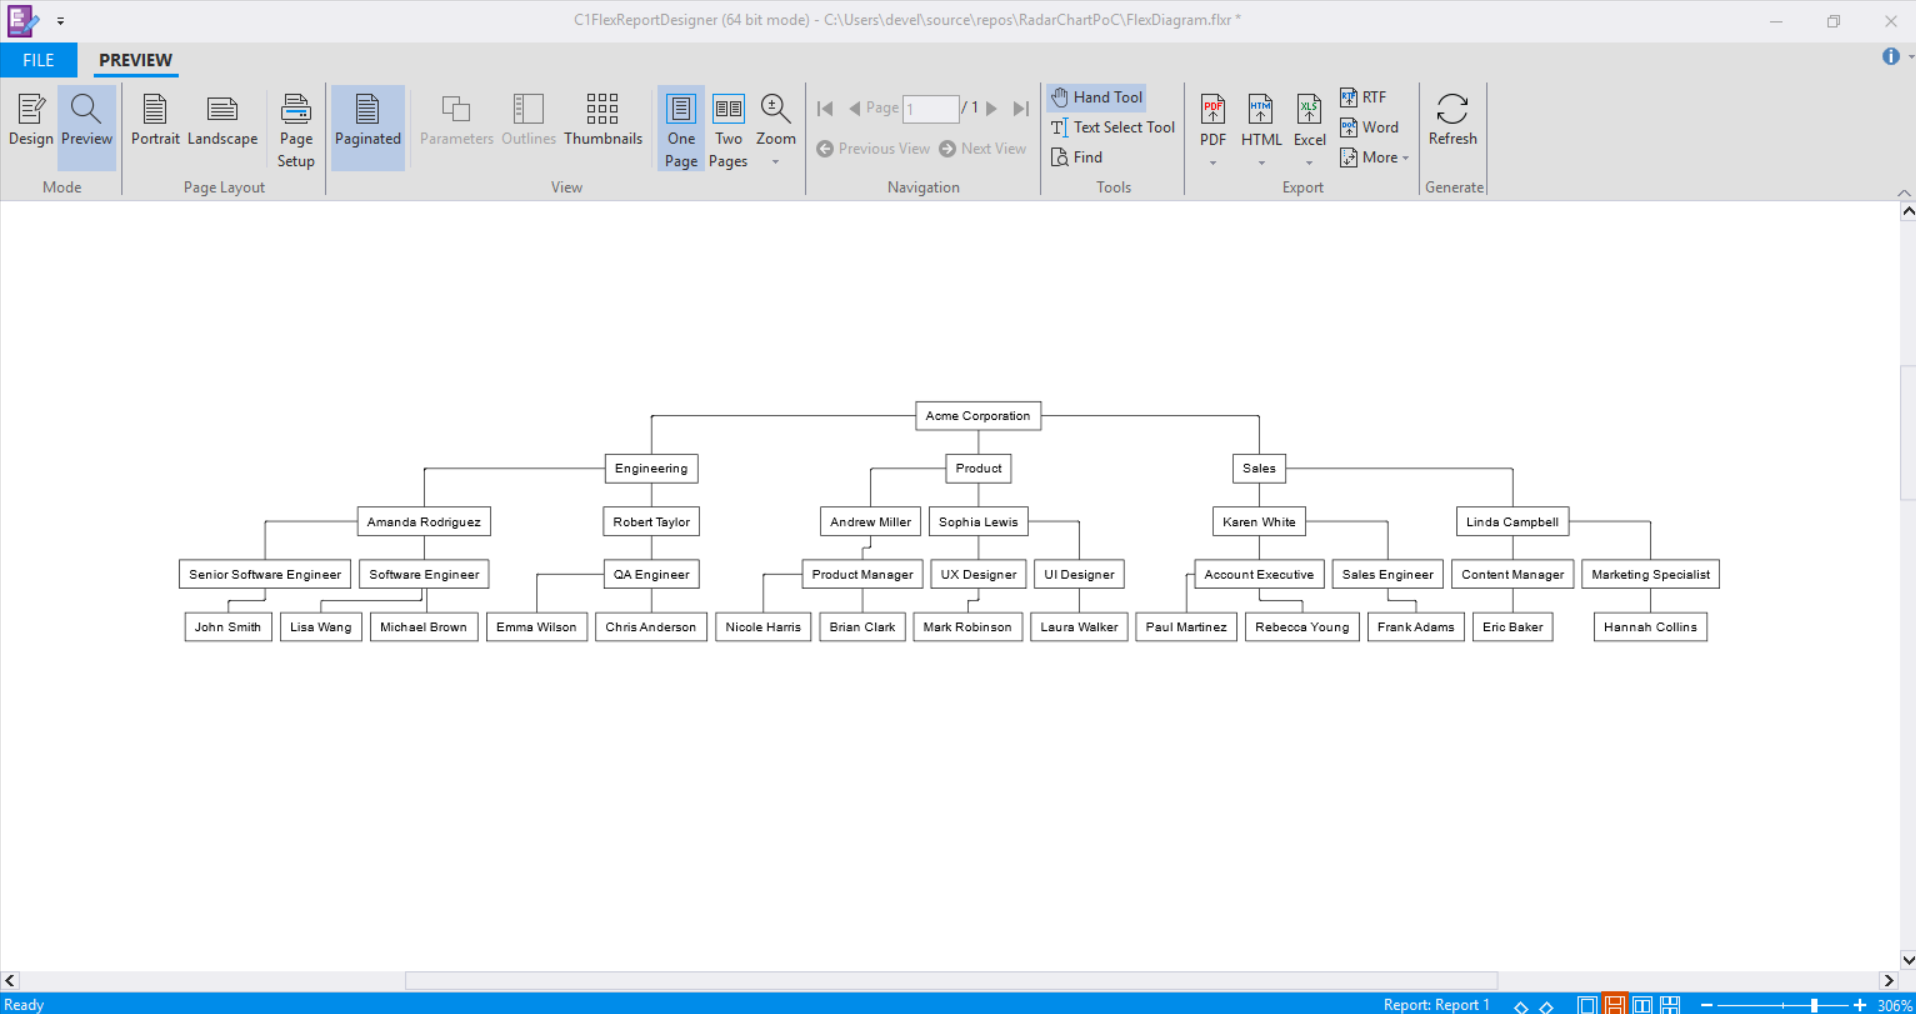
Company, Department, Manager, JobTitle, Employee
- Preview the report to render the diagram.
Define Nodes and Edges (Unbound Mode)
Unbound Mode enables manual construction of diagram structures without using a data source.
To define nodes and edges manually:
-
Create a new report in FlexReportDesigner.
-
On the Insert tab, add the DiagramChart field to the report header section.
-
Select the DiagramChart field on the design surface.
-
In the Properties window, navigate to:
Misc > Diagram > Nodes
Then open the editor
- Add nodes and configure properties such as:
ShapeStyleContentLegendItemTitleTitleImageThen open the editor.
- In the Properties window, navigate to:
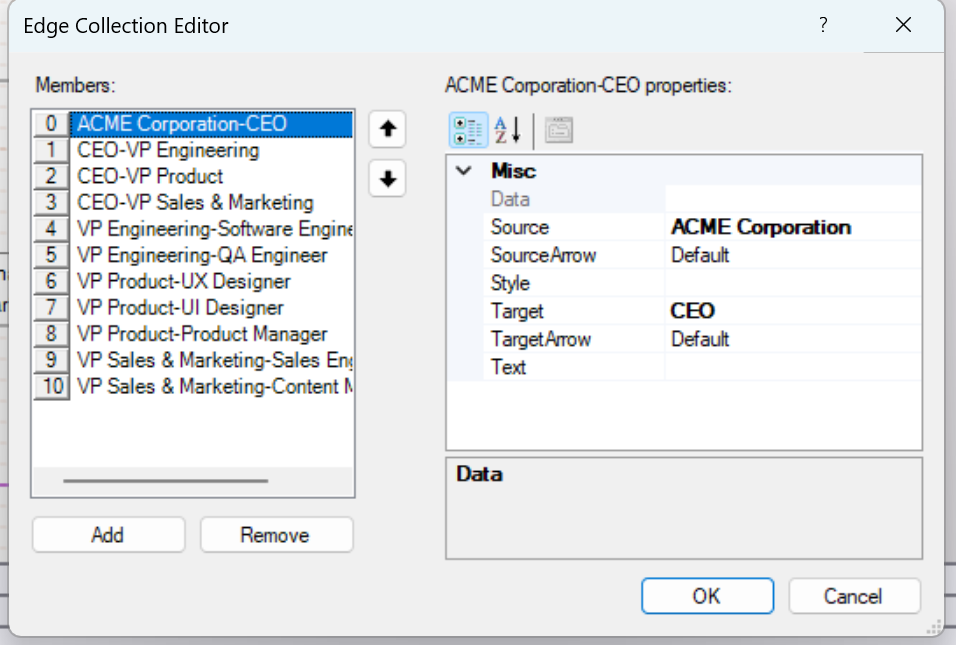
Misc > Diagram > Edges
Then open the editor.
- Define edges by specifying:
SourceTarget
- Preview the report to render the diagram.