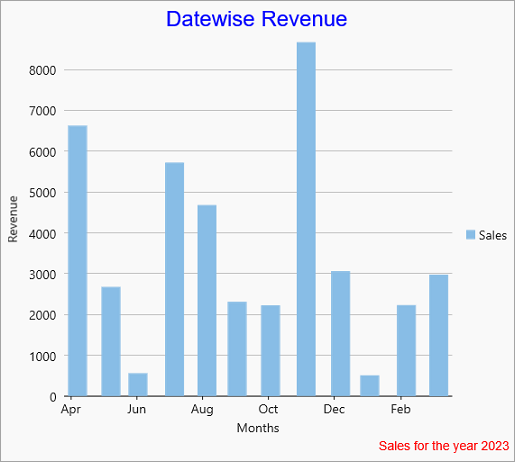
Titles are the text fields that appear on a chart and are used to give description about the chart data.

Set Chart Titles and Styles
There are two types of chart titles that can be added to a FlexChart: a Header and a Footer. Headers are generally used for summarizing the chart and tell what a particular chart is all about. On the other hand, Footers are generally used for mentioning the copyright information or source of data used in the chart. You can set the header and footer of a chart by using the Header and Footer property which are of the type IChartBase interface.
To style the header and footer of a chart so that they match with chart and rest of the UI of your application, FlexChart provides various styling properties through the ChartTitles class. You can style the titles such as setting the font, fill or stroke colors using the HeaderStyle and FooterStyle property. You can also change its HorizontalAlignment, as well as set and customize the Border and BorderStyle using the following code. This example uses the column chart with Sales data series and is bound to the same datasource which is used in the Quick Start topic.
Following C# code required to set the header and footer properties of the chart:
| C# |
コードのコピー
|
|---|---|
flexChart.Header = "Datewise Revenue"; flexChart.Footer = "Sales for the year 2023"; flexChart.AxisX.Title = "Months"; flexChart.AxisY.Title = "Revenue"; flexChart.HeaderStyle = new ChartStyle() { FontFamily = new FontFamily("Arial"), FontSize = 24, Stroke = new SolidColorBrush() { Color = Windows.UI.Color.FromArgb(255, 0, 0, 255) }, }; flexChart.HeaderAlignment = HorizontalAlignment.Center; flexChart.FooterStyle = new ChartStyle() { FontFamily = new FontFamily("Arial"), FontSize = 14, Stroke = new SolidColorBrush() { Color = Windows.UI.Color.FromArgb(255, 255, 0, 0) } }; flexChart.FooterAlignment = HorizontalAlignment.Right; |
|