Overlapping of data labels is one of the most comment issues pertaining to charts. Overlapping, generally, occurs due to long data label text or a large number of data points plotted on a chart. With FlexChart, you get many options to manage your data labels. You can choose any of them according to the chart data and your requirement.
Auto-arrange Data Labels
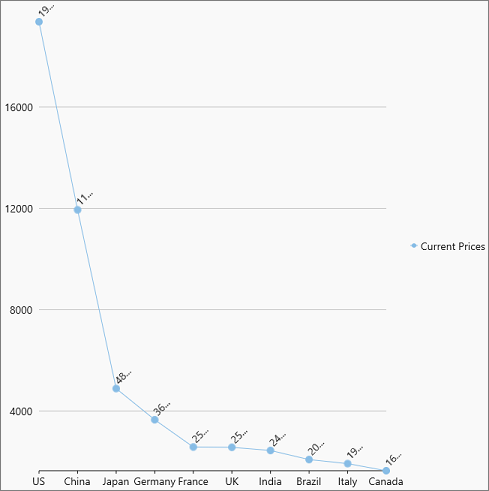
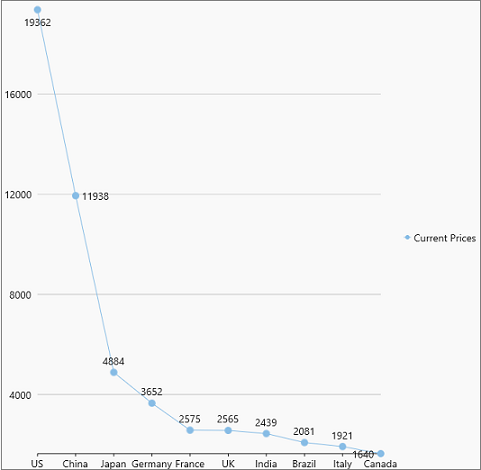
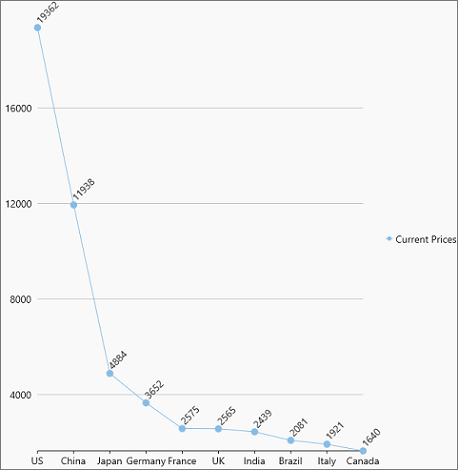
Allowing FlexChart to arrange the data labels automatically according to the available real estate is the most convenient way of handling overlapping data labels. This can be done by setting the Position property of DataLabel class to Auto. For more information about setting the position of data labels, see Data Labels.
|
LabelPosition.Auto |
LabelPosition.Top |
|---|---|
|
|
|
FlexChart also provides MaxAutoLabels property so that you can set maximum number of data labels that FlexChart can position automatically. The default value of MaxAutoLabels property is 100 which means FlexChart creates maximum 100 data labels in a chart. Note that increasing the value of MaxAutoLabels property to a value more than 100 may result in slow rendering of FlexChart as the label positioning algorithm becomes expensive in terms of performance when number of data labels is large. Hence, auto-arrangement of data labels may not be an optimal solution when the number of data labels is too large to fit in the available space. In such case, it is recommended to reduce the number of data labels by hiding them at individual series level.
| C# |
コードのコピー
|
|---|---|
//最大データラベルを表示にします
flexChart.DataLabel.MaxAutoLabels = 5;
|
|
Hide Overlapped Data Labels
FlexChart provides an option to show or hide the overlapped data labels by setting the Overlapping property of DataLabel class. This property accepts the values from LabelOverlapping enumeration.
In case of pie chart and sunburst chart, you can use the Overlapping property of the PieDataLabel class which accepts the values from PieLabelOverlapping enumeration. This property lets you choose to show the data labels, by default, but hides or trims the data labels when label text is larger than the corresponding pie segment.
| C# |
コードのコピー
|
|---|---|
//重なるデータラベルを非表示にします this.flexPie1.DataLabel.Overlapping = PieLabelOverlapping.Hide; |
|
Control Appearance of Overlapped Data Labels
Apart from the options discussed above, you can further refine the settings to manage the overlapping data labels more effectively. You can do this by setting the OverlappingOptions property which accepts the values from LabelOverlappingOptions enumeration. The property gives you options to avoid overlapping completely, allow data labels to overlap with data points or allow them to display outside plot area.
| C# |
コードのコピー
|
|---|---|
//プロット領域の外側にデータラベルを表示にします this.flexChart1.DataLabel.OverlappingOptions = LabelOverlappingOptions.OutsidePlotArea; |
|
Trim Or Wrap Data Labels Text
Another option that FlexChart provides to manage the overlapping of data labels is trimming or wrapping of the data label text if it exceeds a specified character limit or line limit. You can specify whether to trim or wrap the text by setting the ContentOptions property. You can specify the maximum width of data label text after which FlexChart should wrap or trim the text by setting the MaxWidth property. In case of wrapping the text, you can limit the wrapped text to grow vertically by specifying the maximum number of lines until which the data labels should be wrapped. To indicate that the further text is trimmed, FlexChart displays an ellipsis at the end of the data label text if it exceeds the limit defined by the MaxWidth and MaxLines property.

| C# |
コードのコピー
|
|---|---|
//最大幅を超える場合にデータラベルをトリミングします this.flexChart1.DataLabel.ContentOptions = ContentOptions.Trim; this.flexChart1.DataLabel.MaxWidth = 25; |
|

