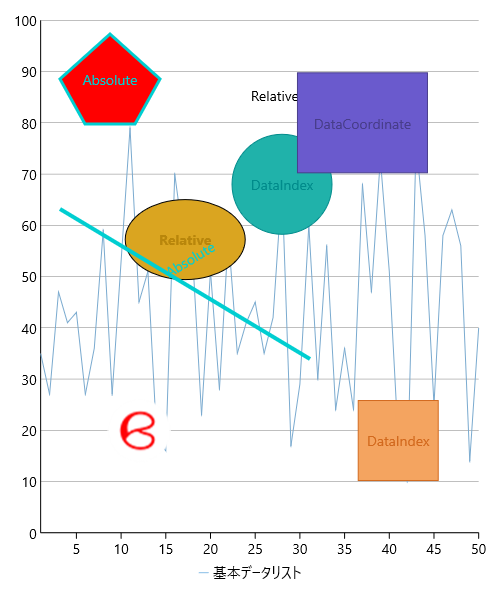
注釈は、重要なニュースまたはイベントをマークするために、FlexChart 上の特定のデータポイントにアタッチして使用されます。注釈は、画像、図形、テキストなどの任意の要素をチャート上に配置するためにも使用できます。Xuni FlexChart コントロールは、多角形、線、楕円、四角形、画像、テキストなどのさまざまな注釈が組み込まれています。
FlexChart 上の注釈の位置は、Position プロパティを Bottom、Center、Left、Right、または Top に設定することで指定できます。FlexChart で注釈の添付方法を指定するには Attachment プロパティを使用し、その値を次のように設定します。
- Absolute:注釈の座標は、注釈の図形データ(ピクセル単位)によって指定されます。
- DataCoordinate:注釈の座標は、データ座標で指定されます。
- DataIndex:注釈の座標は、データ系列インデックスとデータポイントインデックスによって指定されます。
- Relative:注釈の座標は、コントロール内の相対位置として指定されます。(0, 0) は左上隅、(1, 1) は右下隅を表します。
このトピックでは、FlexChart コントロールでさまざまなタイプの注釈を設定する方法を 3 つの手順で説明します。
次の図は、上記の手順を実行した後の FlexChart コントロールを示しています。

手順 1:FlexChart のデータソースの作成
- ソリューションエクスプローラーで、プロジェクト名(Portable app)を右クリックします。
- [追加]→[新しい項目]を選択します。[新しい項目の追加]ダイアログボックスが表示されます。
- ダイアログから[クラス]を選択し、ChartSampleData という名前を付けます。
- [追加]をクリックして、クラスをプロジェクトに追加します。
- ChartSampleData クラスに次のコードを追加します。
C# コードのコピーclass ChartSampleData { public class AnnotationViewModel { List<DataItem> _data; List<DataItem> _simpleData; Random rnd = new Random(); public List<DataItem> Data { get { if (_data == null) { _data = new List<DataItem>(); for (int i = 1; i < 51; i++) { _data.Add(new DataItem() { X = i, Y = rnd.Next(10, 80) }); } } return _data; } } public List<DataItem> SimpleData { get { if (_simpleData == null) { _simpleData = new List<DataItem>(); _simpleData.Add(new DataItem() { X = 1, Y = 30 }); _simpleData.Add(new DataItem() { X = 2, Y = 20 }); _simpleData.Add(new DataItem() { X = 3, Y = 30 }); _simpleData.Add(new DataItem() { X = 4, Y = 65 }); _simpleData.Add(new DataItem() { X = 5, Y = 70 }); _simpleData.Add(new DataItem() { X = 6, Y = 60 }); } return _simpleData; } } } public class DataItem { public int X { get; set; } public int Y { get; set; } } }
手順 2:XAML での FlexChart コントロールの初期化と注釈の追加
- ソリューションエクスプローラーでプロジェクトを右クリックし、[追加|新しい項目]を選択します。[新しい項目の追加]ダイアログボックスが表示されます。
- インストール済みテンプレートから[Forms Xaml ページ]を選択して、Annotations という名前を付けます。
- [追加]をクリックして、ページをプロジェクトに追加します。
- Annotation.xaml ページに次の XAML コードを追加して FlexChart コントロールを初期化します。
XAML コードのコピー<ContentPage xmlns="http://xamarin.com/schemas/2014/forms" xmlns:x="http://schemas.microsoft.com/winfx/2009/xaml" xmlns:Chart="clr-namespace:C1.Xamarin.Forms.Chart;assembly=C1.Xamarin.Forms.Chart" xmlns:Annotation="clr-namespace:C1.Xamarin.Forms.Chart.Annotation;assembly=C1.Xamarin.Forms.Chart" x:Class="Annotations.App"> <Chart:FlexChart x:Name="flexChart" BindingX="Name"> <Chart:FlexChart.AxisY> <Chart:ChartAxis Min="0" Max="100" MajorUnit="10" AxisLine="False" MajorGrid="True" MajorTickMarks="None"/> </Chart:FlexChart.AxisY> <Chart:FlexChart.Series> <Chart:ChartSeries SeriesName="Base dataList" Binding="Y" BindingX="X"/> </Chart:FlexChart.Series> <Chart:FlexChart.Layers> <Annotation:AnnotationLayer> <Annotation:AnnotationLayer.Annotations> <Annotation:Text Content="Relative" Location="0.55, 0.15" Attachment="Relative" > <Annotation:Text.AnnotationStyle> <Chart:ChartStyle FontSize="14" Stroke="Black" FontFamily="GenericSansSerif" /> </Annotation:Text.AnnotationStyle> </Annotation:Text> <Annotation:Ellipse Content="Relative" Location="0.4, 0.45" Width="120" Height="80" Attachment="Relative"> <Annotation:Ellipse.AnnotationStyle> <Chart:ChartStyle Fill="Goldenrod"/> </Annotation:Ellipse.AnnotationStyle> <Annotation:Ellipse.ContentStyle> <Chart:ChartStyle Stroke="DarkGoldenrod" FontAttributes="Bold" FontSize="14" FontFamily="GenericSansSerif" /> </Annotation:Ellipse.ContentStyle> </Annotation:Ellipse> <Annotation:Circle Content="DataIndex" Radius="50" SeriesIndex="0" PointIndex="27" Attachment="DataIndex" > <Annotation:Circle.AnnotationStyle> <Chart:ChartStyle Fill="LightSeaGreen" FontSize="14" Stroke="DarkCyan" FontFamily="GenericSansSerif" FontAttributes="Bold" /> </Annotation:Circle.AnnotationStyle> </Annotation:Circle> <Annotation:Rectangle Content="DataCoordinate" Width="130" Height="100" Location="37, 80" Attachment="DataCoordinate"> <Annotation:Rectangle.AnnotationStyle> <Chart:ChartStyle Fill="SlateBlue" FontSize="14" Stroke="DarkSlateBlue" FontFamily="GenericSansSerif" FontAttributes="Bold" /> </Annotation:Rectangle.AnnotationStyle> </Annotation:Rectangle> <Annotation:Square Content="DataIndex" Length="80" SeriesIndex="0" PointIndex="40" Attachment="DataIndex" > <Annotation:Square.AnnotationStyle> <Chart:ChartStyle Fill="SandyBrown" FontSize="14" Stroke="Chocolate" FontFamily="GenericSansSerif" FontAttributes="Bold" /> </Annotation:Square.AnnotationStyle> </Annotation:Square> <Annotation:Polygon x:Name="polygonAnno" Content="Absolute" Attachment="Absolute"> <Annotation:Polygon.AnnotationStyle> <Chart:ChartStyle Fill="Red" StrokeThickness="3" FontSize="14" Stroke="DarkTurquoise" FontFamily="GenericSansSerif" FontAttributes="Bold" /> </Annotation:Polygon.AnnotationStyle> </Annotation:Polygon> <Annotation:Line Content="Absolute" Start="50, 200" End="300, 350" Attachment="Absolute" > <Annotation:Line.AnnotationStyle> <Chart:ChartStyle StrokeThickness="4" FontSize="14" Stroke="DarkTurquoise" FontFamily="GenericSansSerif" FontAttributes="Bold" /> </Annotation:Line.AnnotationStyle> </Annotation:Line> <Annotation:Image Location="12, 20" x:Name="imageAnno" Width="64" Height="64" Attachment="DataCoordinate" /> </Annotation:AnnotationLayer.Annotations> </Annotation:AnnotationLayer> </Chart:FlexChart.Layers> </Chart:FlexChart> </ContentPage>
手順 3:コードでの連結処理の設定
- ソリューションエクスプローラーで、Annotations.xaml ノードを展開し、Annotations.xaml.cs を開いて、C# コードビハインドを開きます。
- 次のコードに示すように、Annotations() クラスコンストラクタで FlexChart の BindingContext を SampleViewModel に設定し、その他の注釈連結処理を設定します。
C# コードのコピーpublic partial class AnnotationSample : ContentPage { public AnnotationSample() { InitializeComponent(); Title = AppResources.GettingStartedTitle; flexChart.ItemsSource = new AnnotationViewModel().Data; flexChart.ChartType = ChartType.Line; flexChart.BindingX = "X"; flexChart.LegendPosition = ChartPositionType.Bottom; var pngImage = ImageSource.FromResource("<ApplicationName>.Images.butterfly.png"); imageAnno.Source = pngImage; polygonAnno.Points = CreatePoints(); } private System.Collections.ObjectModel.ObservableCollection<Point> CreatePoints() { System.Collections.ObjectModel.ObservableCollection<Point> points = new System.Collections.ObjectModel.ObservableCollection<Point>(); points.Add(new Point(100, 25)); points.Add(new Point(50, 70)); points.Add(new Point(75, 115)); points.Add(new Point(125, 115)); points.Add(new Point(150, 70)); return points; } }