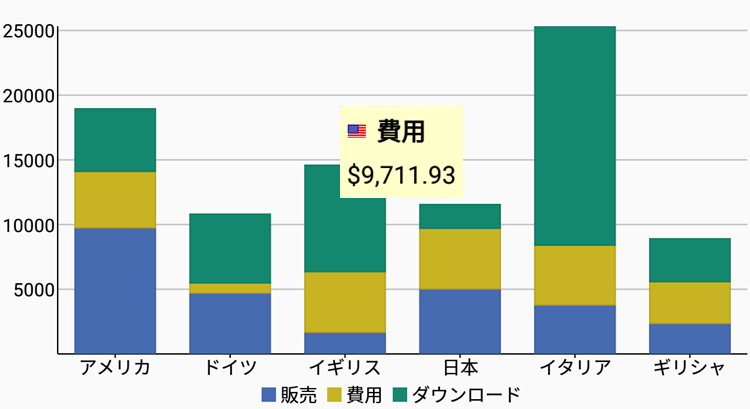
ツールチップは、ユーザーがグラフ上のデータポイントにカーソルを合わせると表示されるラベルです。デフォルトでFlexChartに表示され、データ値とテキストの任意の組み合わせを表示できます。FlexChart を使用すると、ツールチップにラベルや画像を含めることができるカスタマイズされたビューを表示できます。それには、Tooltip.Content プロパティを設定します。ユーザーが FlexChart コントロールの任意の場所をタップすると、このプロパティは Xamarin レイアウトを受け入れ、それをツールチップの形式で表示します。
次の図は、ツールチップが FlexChart に表示されたところです。

次のコード例は、C# と XAML でツールチップをカスタマイズする方法を示します。
Data Source
| C# |
コードのコピー
|
|---|---|
public static class ChartSampleFactory { public static IEnumerable<SalesExpensesDownloadsEntity> CreateEntityList() {o List<SalesExpensesDownloadsEntity> entityList = new List<SalesExpensesDownloadsEntity>(); string[] countries = new string[] { "アメリカ", "ドイツ", "イギリス", "日本", "イタリア", "ギリシャ" }; Random random = new Random(); for (int i = 0; i < countries.Length; i++) { double sales = random.NextDouble() * 10000; double expenses = random.NextDouble() * 5000; double downloads = Math.Round(random.NextDouble() * 20000); entityList.Add(new SalesExpensesDownloadsEntity(countries[i], sales, expenses, downloads, DateTime.Today.AddDays(i))); } return entityList; } } |
|
XAML のコード
CustomTooltip.xamlファイルに次のコードを追加して、FlexChartコントロールを組み込み、ツールチップを追加します。このサンプルで使用されている画像は、ドキュメント\ComponentOne Samples\Xamarin\XF\FlexChart101\FlexChart101.XF\Imagesにあります。
| XAML |
コードのコピー
|
|---|---|
<ContentPage xmlns="http://xamarin.com/schemas/2014/forms" xmlns:x="http://schemas.microsoft.com/winfx/2009/xaml" x:Class="FlexChart101.CustomTooltipsSample" xmlns:c1="clr-namespace:C1.Xamarin.Forms.Chart;assembly=C1.Xamarin.Forms.Chart" xmlns:common="clr-namespace:FlexChart101;assembly=FlexChart101.XF" x:Name="page"> <ContentPage.Resources> <ResourceDictionary> <common:FlagConverter x:Key="converter" /> </ResourceDictionary> </ContentPage.Resources> <StackLayout> <Grid VerticalOptions="FillAndExpand"> <c1:FlexChart x:Name="chart" ItemsSource="{Binding Data}" BindingX="Name" ChartType="Column" VerticalOptions="FillAndExpand"> <c1:FlexChart.Series> <c1:ChartSeries Binding="Sales" SeriesName="販売" /> <c1:ChartSeries Binding="Expenses" SeriesName="費用" /> <c1:ChartSeries Binding="Downloads" SeriesName="ダウンロード" /> </c1:FlexChart.Series> <c1:FlexChart.ToolTip> <c1:ChartTooltip IsOpen="false" BackgroundColor="Blue" Padding="0"> <StackLayout BackgroundColor="#FFFFCA" Padding="5"> <StackLayout Orientation = "Horizontal"> <Image x:Name="image" Source="{Binding ValueX, Mode=OneWay, Converter={StaticResource converter}"/> <Label x:Name="label1" Text="{Binding SeriesName}" TextColor="Black" FontAttributes="Bold" FontSize="15"></Label> </StackLayout> <Label x:Name="label2" Text="{Binding DataY, StringFormat='{0:c2}'}" TextColor="Black" FontSize="15" HorizontalOptions="Center"></Label> </StackLayout> </c1:ChartTooltip> </c1:FlexChart.ToolTip> </c1:FlexChart> </Grid> </StackLayout> </ContentPage> |
|
C# のコード
FlexChartコントロールをデータソースにバインドするには、CustomTooltip.xaml.cs ファイルに次のコードを追加します。
| C# |
コードのコピー
|
|---|---|
public CustomTooltips() { InitializeComponent(); this.chart.ItemsSource = ChartSampleFactory.CreateEntityList(); this.chart.Palette = Palette.Zen; this.chart.LegendPosition = ChartPositionType.Bottom; this.chart.Stacking = ChartStackingType.Stacked; chart.Palette = Palette.Cocoa; } |
|