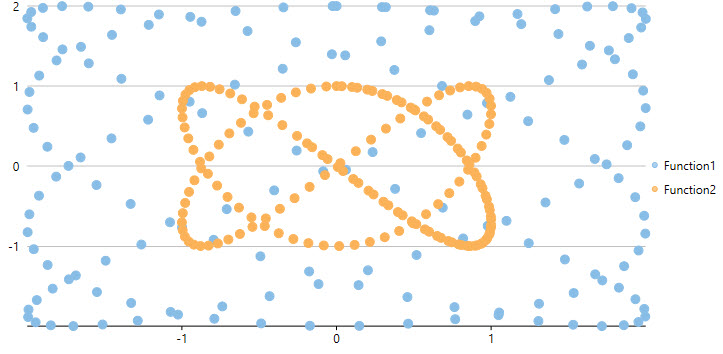
系列へのデータの追加については、強力な連結による方法が提供されています。FlexChart 内の系列を複数のデータソースと連結することができるため、複数のデータソースのデータを組み合わせることができます。複数のデータソースのデータをプロットするには、Series.ItemsSource プロパティを使用する必要があります。
次のコードを参照してください。次のコードでは、DataCreator.cs クラスを使用してデータを生成しています。
<c1:C1FlexChart x:Name="flexChart"
                ItemsSource="{Binding DataContext.Data}"
                ChartType="Scatter">
    <c1:C1FlexChart.Series>
        <c1:Series  x:Name="Function1"
                    SeriesName="関数1"
                    BindingX ="XVals"
                    Binding="YVals"/>
        <c1:Series  x:Name="Function2"
                    SeriesName="関数2"
                    BindingX ="XVals"
                    Binding="YVals"/>
    </c1:C1FlexChart.Series>
</c1:C1FlexChart>
| DataCreator.cs |
コードのコピー
|
|---|---|
class DataCreator { public delegate double MathActionDouble(double num); public delegate double MathActionInt(int num); public static List<DataPoint> Create(MathActionDouble function, double from, double to, double step) { var result = new List<DataPoint>(); var count = (to - from) / step; for (double r = from; r < to; r += step) { result.Add(new DataPoint() { XVals = r, YVals = function(r) }); } return result; } public static List<DataPoint> Create(MathActionInt function, int from, int to, int step) { var result = new List<DataPoint>(); var count = (to - from) / step; for (int r = from; r < to; r += step) { result.Add(new DataPoint() { XVals = r, YVals = function(r) }); } return result; } public static List<DataPoint> Create(MathActionDouble functionX, MathActionDouble functionY, int ptsCount) { var result = new List<DataPoint>(); for (double i = 0; i < ptsCount; i++) { result.Add(new DataPoint() { XVals = functionX(i), YVals = functionY(i) }); } return result; } } public class DataPoint { public double XVals { get; set; } public double YVals { get; set; } } |
|
| MainWindow.xaml.cs |
コードのコピー
|
|---|---|
public partial class MainWindow : Window { List<DataPoint> _function1Source; List<DataPoint> _function2Source; public MainWindow() { this.InitializeComponent(); this.Loaded += Form_Loaded; } private void Form_Loaded(object sender, EventArgs e) { SetupChart(); } void SetupChart() { flexChart.BeginUpdate(); this.Function1.ItemsSource = Function1Source; this.Function2.ItemsSource = Function2Source; flexChart.EndUpdate(); } public List<DataPoint> Function1Source { get { if (_function1Source == null) { _function1Source = DataCreator.Create(x => 2 * Math.Sin(0.16 * x), y => 2 * Math.Cos(0.12 * y), 160); } return _function1Source; } } public List<DataPoint> Function2Source { get { if (_function2Source == null) { _function2Source = DataCreator.Create(x => Math.Sin(0.1 * x), y => Math.Cos(0.15 * y), 160); } return _function2Source; } } } |
|
