FlexChart for WPF
カテゴリ別の軸グループ化
FlexChart > FlexChart の操作 > FlexChart の要素 > FlexChart の軸ラベル > 軸のグループ化 > カテゴリ別の軸グループ化

Categorical axis grouping is applicable in scenarios where the data displayed on the axis is categorical in nature. Categorical data can either be flat or hierarchical. In case you are using flat data, use the GroupNames property to apply axis grouping. And, in case you are using hierarchical data, use the GroupNames and GroupItemsPath property to apply axis grouping.

Moreover, FlexChart allows you to set the group separator using the GroupSeparator property. Also, it allows you to expand or collapse group levels by setting the GroupVisibilityLevel property.

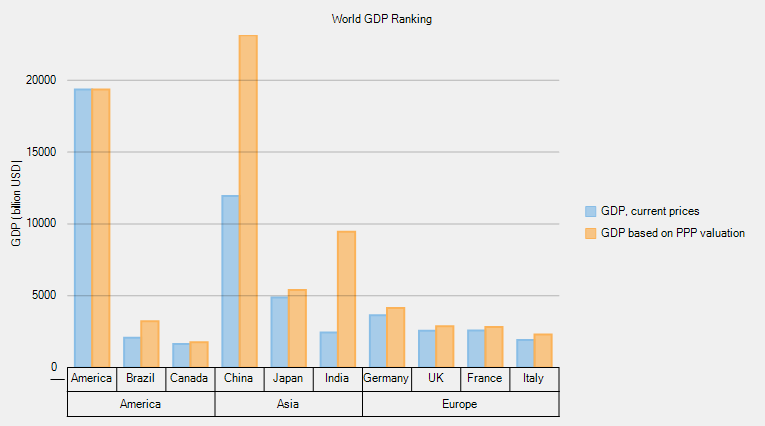
The following image shows how FlexChart appears after setting the categorical axis grouping using flat data.
Add the following code in Index.xaml.

コードのコピー
<c1:C1FlexChart x:Name="flexChart" Background="White" ChartType="Column" BindingX="Country" 
ItemsSource="{Binding Data}" ToolTipContent="{}{x}
{seriesName}{y:n0}" Header="World GDP Ranking" Grid.Row="1" >
            <c1:C1FlexChart.HeaderStyle>
                <c1:ChartStyle FontSize="20" FontFamily="GenericSansSerif"/>
            </c1:C1FlexChart.HeaderStyle>
            <c1:Series SeriesName="GDP, current prices" Binding="CurrentPrices"/>
            <c1:Series SeriesName="GDP based on PPP valuation" Binding="PPPValuation"/>
            <c1:C1FlexChart.AxisX>
                <c1:Axis GroupSeparator="Gird" GroupNames="Continent" GroupVisibilityLevel="-2" />
            </c1:C1FlexChart.AxisX>
            <c1:C1FlexChart.AxisY>
                <c1:Axis Title="GDP (billion USD)" MajorGrid="True"/>
            </c1:C1FlexChart.AxisY>
        </c1:C1FlexChart>