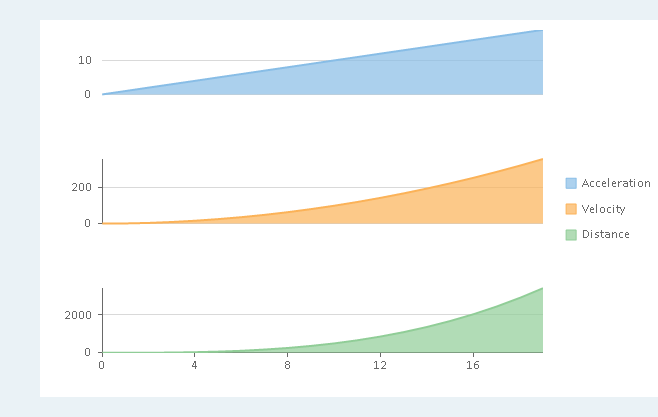
// 複数のプロット領域を作成して追加します。
flexChart.PlotAreas.Add(new PlotArea { PlotAreaName = "plot1", Row = 0 });
flexChart.PlotAreas.Add(new PlotArea { PlotAreaName = "plot2", Row = 2 });
flexChart.PlotAreas.Add(new PlotArea { PlotAreaName = "plot3", Row = 4 });

// チャートタイプを指定します。
flexChart.ChartType = C1.Chart.ChartType.Area;

// 系列を作成、追加とバインドします。
flexChart.Series.Add(new Series()
{
    SeriesName = "加速",
    Binding = "Acceleration",

});

flexChart.Series.Add(new Series()
{
    SeriesName = "速度",
    Binding = "Velocity",
    AxisY = new Axis()
    {
        Position = C1.Chart.Position.Left,
        MajorGrid = true,
        PlotAreaName = "plot2"
    },

});

flexChart.Series.Add(new Series()
{
    SeriesName = "距離 ",
    Binding = "Distance",
    AxisY = new Axis()
    {
        Position = C1.Chart.Position.Left,
        MajorGrid = true,
        PlotAreaName = "plot3"
    }
});
