FlexGrid lets you compute and display aggregate value for each group created after grouping data. The control shows groups in a collapsible outline format and automatically displays the number of items in each group. However, you can go one step further and display aggregate values for every grouped column. This feature enables users in drawing out more insights from random data.
FlexGrid では、データをグループ化した後に、作成された各グループの集計値を計算して表示できます。コントロールは、折りたたみ可能なアウトライン形式でグループを表示し、各グループの項目数を自動的に表示します。ただし、さらに詳しくグループ化列の集計値を表示することもできます。この機能を使用して、ランダムなデータからさらに深い洞察を得ることができます。
次のセクションでは、FlexGrid .NET 4.5.2および.NET 5バージョンでデータ集約を実装する方法を説明します。
たとえば、国または製品カテゴリに基づいてグループ化された企業の売上データには、グリッド自体に各国および製品カテゴリごとの売上集計値が示されるとさらに便利です。Column クラスには GroupAggregate プロパティがあり、これを Aggregate に設定すると、自動的に集計値が計算および表示されます。GroupAggregate プロパティを設定して計算された集計は、データが変更されると自動的に集計値が再計算されます。
次の図に、列に集計値が表示された FlexGrid を示します。

コードから集計を設定するには
グリッドの AreGroupHeadersFrozen プロパティを false に設定し、各列の GroupAggregate プロパティをサポートされる集計値のいずれかに設定すると、FlexGrid の各グループに集計値を表示できます。サポートされている集計値には、合計、平均、カウント、最小、最大などがあります。
メモ: 集計はグループヘッダー列に表示されるため、AreGroupHeadersFrozen プロパティを false に設定してヘッダーを表示する必要があります。
次のコードは、Price、Cost、Weight、Volume の各列の合計を XAML から表示します。
| XAML |
コードのコピー
|
|---|---|
<fg:C1FlexGrid x:Name="_flex" AutoGenerateColumns="False" AreRowGroupHeadersFrozen="False"> <fg:C1FlexGrid.Columns> <fg:Column Header="Line" Binding="{Binding Line}" /> <fg:Column Header="Color" Binding="{Binding Color}" /> <fg:Column Header="Name" Binding="{Binding Name}" /> <fg:Column Header="Price" Binding="{Binding Price}" Format="n2" HorizontalAlignment="Right" Width="*" GroupAggregate="Sum"/> <fg:Column Header="Cost" Binding="{Binding Cost}" Format="n2" HorizontalAlignment="Right" Width="*" GroupAggregate="Sum"/> <fg:Column Header="Weight" Binding="{Binding Weight}" Format="n2" HorizontalAlignment="Right" Width="*" GroupAggregate="Sum"/> <fg:Column Header="Volume" Binding="{Binding Volume}" Format="n2" HorizontalAlignment="Right" Width="*" GroupAggregate="Sum"/> </fg:C1FlexGrid.Columns> </fg:C1FlexGrid> |
|
たとえば、国または製品カテゴリに基づいてグループ化された企業の売上データには、グリッド自体に各国および製品カテゴリごとの売上集計値が示されるとさらに便利です。GridColumn クラスには Aggregate プロパティがあり、これを Aggregate に設定すると、自動的に集計値が計算および表示されます。GroupAggregate プロパティを設定して計算された集計は、データが変更されると自動的に集計値が再計算されます。
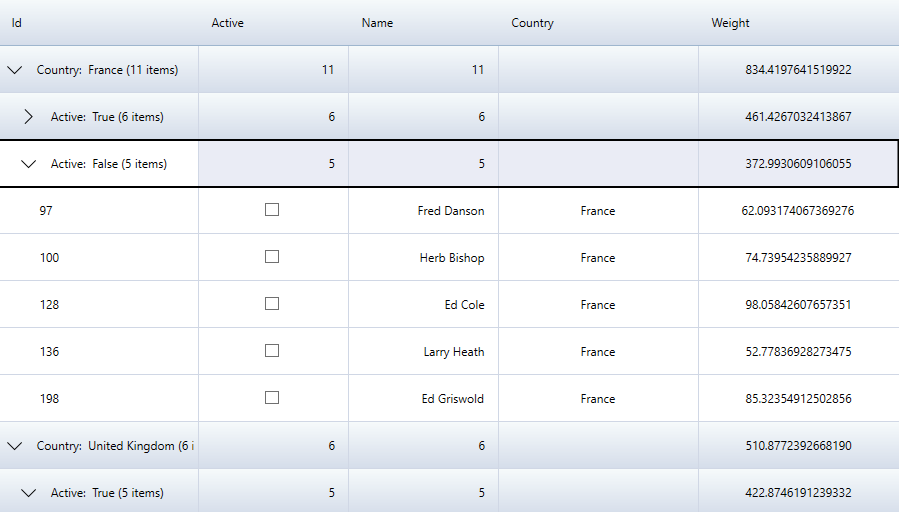
次の図に、列に集計値が表示された FlexGrid を示します。

コードから集計を設定するには
FlexGridの各グループの集計値を表示するには、各列のAggregateプロパティをサポートされている集計値の1つに設定します。サポートされている集計値には、合計、平均、カウント、最小、最大などがあります。次のコードは、XAMLにて[Active]列と[Name]列の[カウント]、および[Weight]の合計を表示しています。
| XAML |
コードのコピー
|
|---|---|
<c1:FlexGrid Name='grid' AutoGenerateColumns="False" Style="{StaticResource excelBlue}" MinColumnWidth="10" MaxColumnWidth="300" HorizontalAlignment="Center" GroupHeaderFormat="{} {name}: {value} ({count:n0} items)" HeadersVisibility="All" Height="700" Width="1000"> <c1:FlexGrid.Columns> <c1:GridColumn Binding="Id" Width="200"/> <c1:GridColumn Binding="Active" HorizontalAlignment="Right" Aggregate="Count"/> <c1:GridColumn Binding="Name" HorizontalAlignment="Right" Aggregate="Count"/> <c1:GridColumn Binding="Country" Width="200" HorizontalAlignment ="Center" /> <c1:GridColumn Binding="Weight" Width="200" HorizontalAlignment ="Center" Aggregate="Sum"/> </c1:FlexGrid.Columns> </c1:FlexGrid> |
|