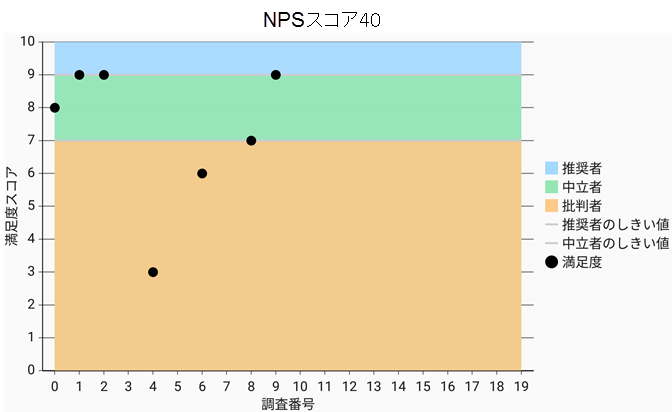
FlexChart を使用すると、色分けされたゾーンと呼ばれる領域を作成してチャートに適用できます。この色分けされたゾーンにより、チャートにプロットされたデータポイントがいくつかの領域に分類され、ユーザーは容易にデータを読み取って理解できるようになります。ユーザーは、特定のデータポイントが属するカテゴリを簡単に特定できます。
ゾーンの作成がどのように役立つかを説明するために、顧客が特定の製品の推奨者か、中立者か、批判者かの識別を目的とした顧客満足度調査を考えます。調査で記録された回答から NPS(ネットプロモータースコア)を計算することで、顧客を推奨者、中立者、批判者に分類できます。このシナリオは FlexChart で実現できます。具体的には、顧客の回答をデータポイントとしてチャートにプロットし、プロットされたデータポイントを面グラフで色分けされたゾーンに分類します。ゾーンは線タイプのデータ系列で区切られます。

FlexChart でのゾーンの作成
FlexChart では、ChartSeries クラスに基づくデータ系列としてゾーンを作成できます。各ゾーンは面グラフとして作成できます。それには、 ChartType プロパティを AREA に設定し、それぞれを固有の色で強調表示します。各ゾーンを区切るために、線タイプのデータ系列をしきい値としてチャートに作成できます。
FlexChart にゾーンを作成するには、次の手順を実行します。
手順 1:調査結果データを記録するクラスを作成します
- パッケージエクスプローラーで、プロジェクト名を右クリックします。
- [新規]→[クラス]を選択して、プロジェクトに新しい Java クラスを追加します。
- SurveyResult という名前を付けて、[完了]をクリックします。
-
SurveyResult クラスに次のコードを追加します。
Java コードのコピーimport android.graphics.Point; import com.grapecity.xuni.core.ObservableList; public class SurveyResult { public int surveyNumber; public int satisfaction; static ObservableList<Point> zone1 = new ObservableList<Point>(); public static ObservableList<Point> getZone1() { return zone1; } static ObservableList<Point> zone2 = new ObservableList<Point>(); public static ObservableList<Point> getZone2() { return zone2; } static ObservableList<Point> zone3 = new ObservableList<Point>(); public static ObservableList<Point> getZone3() { return zone3; } static ObservableList<Point> threshold1 = new ObservableList<Point>(); public static ObservableList<Point> getThreshold1() { return threshold1; } static ObservableList<Point> threshold2 = new ObservableList<Point>(); public static ObservableList<Point> getThreshold2() { return threshold2; } static int[] scores = {8, 9, 9, 10, 3, 10, 6, 10, 7, 9}; public SurveyResult(int surveyNumber, int satisfaction) { this.surveyNumber = surveyNumber; this.satisfaction = satisfaction; } //SurveyResult のオブジェクトのリストを作成するメソッド public static ObservableList<SurveyResult> getSurveyResult() { ObservableList<SurveyResult> results = new ObservableList<SurveyResult>(); //ゾーンとしきい値のポイントを設定します for(int i=0; i <10; i++) { results.add(new SurveyResult(i, scores[i])); zone1.add(new Point(i, 10)); zone2.add(new Point(i, 9)); zone3.add(new Point(i, 7)); threshold1.add(new Point(i, 9)); threshold2.add(new Point(i, 7)); } return results; } public static double getNPS(int[] scores) { double promoter = 0; double detractor = 0; for(int score:scores) { if (score >= 9) { promoter++; } else if (score < 7) { detractor++; } } double nps = ((promoter - detractor)/ scores.length) * 100; return nps; } }
手順 2:FlexChart コントロールを初期化してゾーンを作成します
-
MainActivity.java クラスファイルに切り替え、次の Import 文を追加します。
Java コードのコピーimport android.app.Activity; import android.graphics.Color; import android.os.Bundle; import com.grapecity.xuni.flexchart.ChartSeries; import com.grapecity.xuni.flexchart.ChartType; import com.grapecity.xuni.flexchart.FlexChart;
- FlexChart コントロールを初期化してデータに連結し、基本的なプロパティを設定します。
Java コードのコピーpublic class MainActivity extends Activity { private FlexChart chart; @Override protected void onCreate(Bundle savedInstanceState) { super.onCreate(savedInstanceState); setContentView(R.layout.activity_main); chart = (FlexChart) findViewById(R.id.flexchart); chart.setItemsSource(SurveyResult.getSurveyResult()); chart.getAxisX().setTitle("調査番号"); chart.getAxisY().setTitle("満足度スコア"); } }
-
ChartSeries クラスのインスタンスを初期化し、MainActivity.java クラスファイルのデータに連結して、いくつかのゾーンを作成します。
Java コードのコピー// 推奨者のゾーン 1 ChartSeries seriesZone1 = new ChartSeries(chart, "Promoter", "y"); seriesZone1.setItemsSource(SurveyResult.getZone1()); seriesZone1.setChartType(ChartType.AREA); seriesZone1.setName("推奨者"); seriesZone1.setBinding("y"); seriesZone1.setBindingX("x"); seriesZone1.setColor(Color.parseColor("#A3D9FF")); // 中立者のゾーン 2 ChartSeries seriesZone2 = new ChartSeries(chart, "Passive", "y"); seriesZone2.setItemsSource(SurveyResult.getZone2()); seriesZone2.setChartType(ChartType.AREA); seriesZone2.setName("中立者"); seriesZone2.setBinding("y"); seriesZone2.setBindingX("x"); seriesZone2.setColor(Color.parseColor("#96E6B3")); // 批判者のゾーン 2 ChartSeries seriesZone3 = new ChartSeries(chart, "Detractor", "y"); seriesZone3.setItemsSource(SurveyResult.getZone3()); seriesZone3.setChartType(ChartType.AREA); seriesZone3.setName("批判者"); seriesZone3.setBinding("y"); seriesZone3.setBindingX("x"); seriesZone3.setColor(Color.parseColor("#FCC989")); // ゾーンをチャートに追加します chart.getSeries().add(seriesZone1); chart.getSeries().add(seriesZone2); chart.getSeries().add(seriesZone3); // 推奨者のしきい値線 ChartSeries seriesThreshold1 = new ChartSeries(chart, "Promoter Threshold", "y"); seriesThreshold1.setItemsSource(SurveyResult.getThreshold1()); seriesThreshold1.setChartType(ChartType.LINE); seriesThreshold1.setName("推奨者のしきい値"); seriesThreshold1.setBinding("y"); seriesThreshold1.setBindingX("x"); seriesThreshold1.setColor(Color.LTGRAY); // 中立者のしきい値線 ChartSeries seriesThreshold2 = new ChartSeries(chart, "Passive Threshold", "y"); seriesThreshold2.setItemsSource(SurveyResult.getThreshold2()); seriesThreshold2.setChartType(ChartType.LINE); seriesThreshold2.setName("中立者のしきい値"); seriesThreshold2.setBinding("y"); seriesThreshold2.setBindingX("x"); seriesThreshold2.setColor(Color.LTGRAY); // しきい値線をチャートに追加します chart.getSeries().add(seriesThreshold1); chart.getSeries().add(seriesThreshold2); // 顧客満足度結果を追加します ChartSeries satisfactionSeries = new ChartSeries(chart, "満足度", "satisfaction"); satisfactionSeries.setChartType(ChartType.SCATTER); satisfactionSeries.setColor(Color.BLACK); chart.getSeries().add(satisfactionSeries);
手順 3:FlexChart コントロールのレイアウトを設定します
-
activity_main レイアウトファイルに切り替え、次の XML コードを追加して、FlexChart コントロールのレイアウトを設定します。
XML コードのコピー<RelativeLayout xmlns:android="http://schemas.android.com/apk/res/android" xmlns:tools="http://schemas.android.com/tools" android:layout_width="match_parent" android:layout_height="match_parent" tools:context="com.example.surveyzones.MainActivity" > <com.grapecity.xuni.flexchart.FlexChart android:id="@+id/flexchart" android:layout_width="match_parent" android:layout_height="match_parent" > </com.grapecity.xuni.flexchart.FlexChart> </RelativeLayout>