注釈は、重要なニュースまたはイベントをマークするために、FlexChart 上の特定のデータポイントにアタッチして使用されます。注釈は、画像、図形、テキストなどの任意の要素をチャート上に配置するためにも使用できます。Xuni FlexChart コントロールは、多角形、線、楕円、四角形、画像、テキストなどのさまざまな注釈が組み込まれています。
FlexChart 上の注釈の位置は、Position プロパティを Bottom、Center、Left、Right、または Top に設定することで指定できます。FlexChart で注釈の添付方法を指定するには Attachment プロパティを使用し、その値を次のように設定します。
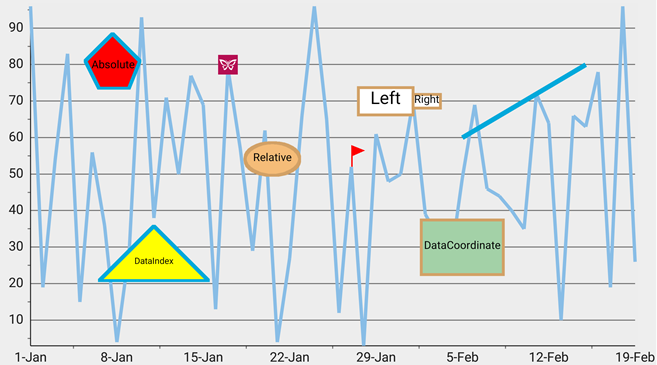
- Absolute:注釈の座標は、注釈の図形データ(ピクセル単位)によって指定されます。
- DataCoordinate:注釈の座標は、データ座標で指定されます。
- DataIndex:注釈の座標は、データ系列インデックスとデータポイントインデックスによって指定されます。
- Relative:注釈の座標は、コントロール内の相対位置として指定されます。(0, 0) は左上隅、(1, 1) は右下隅を表します。
次の図は、注釈を適用した後の FlexChart コントロールを示しています。
注釈を FlexChart コントロールに適用するには、次の手順を実行します。
- MainActivity クラスに、次の import 文を追加します。
Java コードのコピーimport android.graphics.Color; import android.graphics.PointF; import java.util.ArrayList; import java.util.List; import com.grapecity.xuni.chartcore.ChartPositionType; import com.grapecity.xuni.flexchart.*;
- MainActivity ファイルのコードを次のコードに置き換えます。.
Java コードのコピーpublic class MainActivity extends Activity { private FlexChart mChart; @Override protected void onCreate(Bundle savedInstanceState) { super.onCreate(savedInstanceState); setContentView(R.layout.activity_main); com.grapecity.xuni.core.LicenseManager.KEY = License.KEY; mChart = (FlexChart) findViewById(R.id.flexchart); mChart.getLegend().setPosition(ChartPositionType.NONE); mChart.setChartType(ChartType.LINE); mChart.setBindingX("date"); ChartSeries seriesSales = new ChartSeries(mChart, "value", "value"); mChart.getSeries().add(seriesSales); mChart.setItemsSource(getDataSource()); mChart.getAxisY().setMajorUnit(10d); mChart.getAxisX().setMajorUnit(7d); ChartPolygonAnnotation polygon = new ChartPolygonAnnotation(); polygon.getPoints().add(new PointF(300, 100)); polygon.getPoints().add(new PointF(200, 200)); polygon.getPoints().add(new PointF(250, 300)); polygon.getPoints().add(new PointF(360, 300)); polygon.getPoints().add(new PointF(400, 200)); polygon.setBorderWidth(3); polygon.setBorderColor(Color.rgb(1, 169, 219)); polygon.setColor(Color.RED); polygon.setText("Absolute"); polygon.setFontSize(10); polygon.setTooltipText("This is polygon annotation. \r\n Attachment : Absolute \r\n Paths: [(300,100),(200,100),(250,300),(360,300),(400,200)]"); mChart.getAnnotations().add(polygon); ChartPolygonAnnotation triangle = new ChartPolygonAnnotation(); triangle.setAttachment(ChartAnnotationAttachment.DataIndex); triangle.setSeriesIndex(0); triangle.setPointIndex(10); triangle.setOffset(new PointF(0, 30)); triangle.getPoints().add(new PointF(0, 0)); triangle.getPoints().add(new PointF(-200, 200)); triangle.getPoints().add(new PointF(200, 200)); triangle.setBorderWidth(3); triangle.setBorderColor(Color.rgb(1, 169, 219)); triangle.setColor(Color.YELLOW); triangle.setText("DataIndex"); triangle.setFontSize(8); triangle.setTooltipText("This is polygon annotation. \r\n Attachment : DataIndex \r\n Paths: [(0,0),(-100,200),(100,200)] \r\n Offset: {x:0, y:30}"); mChart.getAnnotations().add(triangle); ChartPolygonAnnotation flag = new ChartPolygonAnnotation(); flag.setAttachment(ChartAnnotationAttachment.DataIndex); flag.setSeriesIndex(0); flag.setPointIndex(26); flag.getPoints().add(new PointF(0, 0)); flag.getPoints().add(new PointF(0, -80)); flag.getPoints().add(new PointF(50, -60)); flag.getPoints().add(new PointF(5, -40)); flag.getPoints().add(new PointF(5, 0)); flag.setBorderWidth(0); flag.setColor(Color.RED); flag.setTooltipText("This is polygon annotation. \r\n Attachment : DataIndex \r\n Paths: [(0,0),(0,-80),(50,-60),(5,-40),(5,0)] \r\n"); mChart.getAnnotations().add(flag); ChartEllipseAnnotation ellipse = new ChartEllipseAnnotation(); ellipse.setAttachment(ChartAnnotationAttachment.Relative); ellipse.setPoint(new PointF(0.4f, 0.45f)); ellipse.setWidth(200); ellipse.setHeight(120); ellipse.setBorderWidth(3); ellipse.setBorderColor(Color.rgb(210, 161, 102)); ellipse.setColor(Color.rgb(245, 188, 120)); ellipse.setText("Relative"); ellipse.setFontSize(10); ellipse.setTooltipText("This is ellipse annotation. \r\n Attachment : Relative \r\n Point: {x:0.4, y:0.45}"); mChart.getAnnotations().add(ellipse); ChartLineAnnotation line = new ChartLineAnnotation(); line.setAttachment(ChartAnnotationAttachment.DataCoordinate); line.setStart(new PointF(35, 60)); line.setEnd(new PointF(45, 80)); line.setLineWidth(5); line.setColor(Color.rgb(1, 169, 219)); line.setTooltipText("This is line annotation.\r\n Attachment : DataCoordinate \r\n Start: {x:35, y:60} End: {X:45, y:80}"); mChart.getAnnotations().add(line); ChartRectangleAnnotation rect = new ChartRectangleAnnotation(); rect.setAttachment(ChartAnnotationAttachment.DataCoordinate); rect.setPoint(new PointF(35, 30)); rect.setWidth(300); rect.setHeight(200); rect.setColor(Color.rgb(163, 209, 167)); rect.setBorderColor(Color.rgb(210, 161, 102)); rect.setBorderWidth(3); rect.setFontSize(10); rect.setText("DataCoordinate"); rect.setTooltipText("This is rectangle annotation.\r\n Attachment : DataCoordinate \r\n Point: {x:35, y:30}"); mChart.getAnnotations().add(rect); ChartRectangleAnnotation left = new ChartRectangleAnnotation(); left.setAttachment(ChartAnnotationAttachment.DataIndex); left.setPointIndex(31); left.setSeriesIndex(0); left.setWidth(200); left.setHeight(100); left.setPosition(ChartAnnotationPosition.Left); left.setColor(Color.WHITE); left.setBorderColor(Color.rgb(210, 161, 102)); left.setBorderWidth(3); left.setFontSize(16); left.setText("Left"); left.setTooltipText("This is rectangle annotation.\r\n Attachment : DataIndex \r\n PointIndex: 31 \r\n Position: Left"); mChart.getAnnotations().add(left); ChartRectangleAnnotation right = new ChartRectangleAnnotation(); right.setAttachment(ChartAnnotationAttachment.DataIndex); right.setPointIndex(31); right.setSeriesIndex(0); right.setWidth(100); right.setHeight(50); right.setPosition(ChartAnnotationPosition.Right); right.setColor(Color.WHITE); right.setBorderColor(Color.rgb(210, 161, 102)); right.setBorderWidth(3); right.setFontSize(10); right.setText("Right"); right.setTooltipText("This is rectangle annotation.\r\n Attachment : DataIndex \r\n PointIndex: 31 \r\n Position: Right"); mChart.getAnnotations().add(right); ChartImageAnnotation image = new ChartImageAnnotation(); image.setAttachment(ChartAnnotationAttachment.DataCoordinate); image.setPoint(new PointF(16, 80)); image.setWidth(72); image.setHeight(72); image.setTooltipText("This is image annotation. \r\n Attachment : DataCoordinate \r\n Point: {x:16, y:80}"); image.setSource(android.graphics.BitmapFactory.decodeResource(this.getResources(), R.drawable.icon)); mChart.getAnnotations().add(image); } private List<TestObject> getDataSource() { List<TestObject> objects = new ArrayList<TestObject>(); objects.add(new TestObject("1-Jan", 96)); objects.add(new TestObject("2-Jan", 19)); objects.add(new TestObject("3-Jan", 54)); objects.add(new TestObject("4-Jan", 83)); objects.add(new TestObject("5-Jan", 15)); objects.add(new TestObject("6-Jan", 56)); objects.add(new TestObject("7-Jan", 36)); objects.add(new TestObject("8-Jan", 4)); objects.add(new TestObject("9-Jan", 29)); objects.add(new TestObject("10-Jan", 93)); objects.add(new TestObject("11-Jan", 38)); objects.add(new TestObject("12-Jan", 71)); objects.add(new TestObject("13-Jan", 50)); objects.add(new TestObject("14-Jan", 77)); objects.add(new TestObject("15-Jan", 69)); objects.add(new TestObject("16-Jan", 13)); objects.add(new TestObject("17-Jan", 79)); objects.add(new TestObject("18-Jan", 57)); objects.add(new TestObject("19-Jan", 29)); objects.add(new TestObject("20-Jan", 62)); objects.add(new TestObject("21-Jan", 4)); objects.add(new TestObject("22-Jan", 27)); objects.add(new TestObject("23-Jan", 66)); objects.add(new TestObject("24-Jan", 96)); objects.add(new TestObject("25-Jan", 65)); objects.add(new TestObject("26-Jan", 12)); objects.add(new TestObject("27-Jan", 52)); objects.add(new TestObject("28-Jan", 3)); objects.add(new TestObject("29-Jan", 61)); objects.add(new TestObject("30-Jan", 48)); objects.add(new TestObject("31-Jan", 50)); objects.add(new TestObject("1-Feb", 70)); objects.add(new TestObject("2-Feb", 39)); objects.add(new TestObject("3-Feb", 33)); objects.add(new TestObject("4-Feb", 25)); objects.add(new TestObject("5-Feb", 49)); objects.add(new TestObject("6-Feb", 69)); objects.add(new TestObject("7-Feb", 46)); objects.add(new TestObject("8-Feb", 44)); objects.add(new TestObject("9-Feb", 40)); objects.add(new TestObject("10-Feb", 35)); objects.add(new TestObject("11-Feb", 72)); objects.add(new TestObject("12-Feb", 64)); objects.add(new TestObject("13-Feb", 10)); objects.add(new TestObject("14-Feb", 66)); objects.add(new TestObject("15-Feb", 63)); objects.add(new TestObject("16-Feb", 78)); objects.add(new TestObject("17-Feb", 19)); objects.add(new TestObject("18-Feb", 96)); objects.add(new TestObject("19-Feb", 26)); return objects; } class TestObject { public String date; public double value; public TestObject(String date, double value) { this.date = date; this.value = value; } } }
- パッケージエクスプローラーで、アプリケーションを右クリックし、[実行]→[Android アプリケーション]をクリックして、FlexChart コントロールに注釈が適用されていることを確認します。