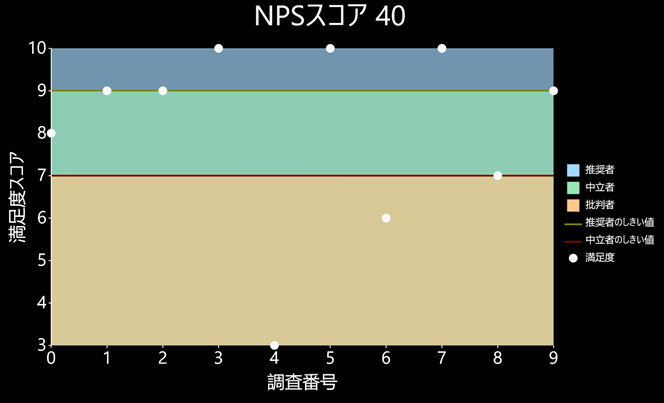
FlexChart を使用すると、色分けされたゾーンと呼ばれる領域を作成してチャートに適用できます。この色分けされたゾーンにより、チャートにプロットされたデータポイントがいくつかの領域に分類され、ユーザーは容易にデータを読み取って理解できるようになります。ユーザーは、特定のデータポイントが属するカテゴリを簡単に特定できます。
ゾーンの作成がどのように役立つかを説明するために、顧客が特定の製品の推奨者か、中立者か、批判者かの識別を目的とした顧客満足度調査を考えます。調査で記録された回答から NPS(ネットプロモータースコア)を計算することで、顧客を推奨者、中立者、批判者に分類できます。このシナリオは FlexChart で実現できます。具体的には、顧客の回答をデータポイントとしてチャートにプロットし、プロットされたデータポイントを面グラフで色分けされたゾーンに分類します。ゾーンは線タイプのデータ系列で区切られます。

FlexChart でのゾーンの作成
FlexChart では、ChartSeries クラスに基づくデータ系列としてゾーンを作成できます。各ゾーンは面グラフとして作成できます。それには、 ChartType プロパティを Area に設定し、それぞれを固有の色で強調表示します。各ゾーンを区切るために、線タイプのデータ系列をしきい値としてチャートに作成できます。
FlexChart にゾーンを作成するには、次の手順を実行します。
手順 1:調査結果データを記録するクラスを作成します
- ソリューションエクスプローラーで、プロジェクト名(portable app)を右クリックします。
- [追加]→[新しい項目]を選択します。[新しい項目の追加]ダイアログボックスが表示されます。
- ダイアログから[クラス]を選択し、SurveyResult という名前を付けます。
- [追加]をクリックして、クラスをプロジェクトに追加します。
-
SurveyResult クラスに次のコードを追加します。
C# コードのコピーpublic class SurveyResult { public int surveyNumber { get; set; } public int satisfaction { get; set; } public SurveyResult(int surveyNumber, int satisfaction) { this.surveyNumber = surveyNumber; this.satisfaction = satisfaction; } }
手順 2:FlexChart コントロールを初期化します
- ソリューションエクスプローラーでプロジェクトを右クリックし、[追加|新しい項目]を選択します。[新しい項目の追加]ダイアログボックスが表示されます。
- インストール済みテンプレートから[Forms XAML ページ]を選択し、SurveyZonesPage という名前を付けます。
- [追加]をクリックして、XAML ページをプロジェクトに追加します。
- SurveyZonesPage.xaml ページに次の XAML コードを追加して FlexChart コントロールを初期化します。
XAML コードのコピー<?xml version="1.0" encoding="utf-8"?> <ContentPage xmlns="http://xamarin.com/schemas/2014/forms" xmlns:x="http://schemas.microsoft.com/winfx/2009/xaml" xmlns:local="clr-namespace:SurveyZones" xmlns:xuni="clr-namespace:Xuni.Forms.FlexChart;assembly=Xuni.Forms.FlexChart" x:Class="SurveyZones.SurveyZonesPage" Padding="15"> <StackLayout> <Label x:Name="lbl" HorizontalOptions="Center" Font="Large"/> <Grid VerticalOptions="FillAndExpand" > <xuni:FlexChart x:Name="chart" BindingX="surveyNumber" VerticalOptions="FillAndExpand" ChartType="Scatter" Grid.Row="0"> <xuni:FlexChart.AxisX> <xuni:ChartAxis AxisLineVisible="false" MajorGridVisible="false" TitleText="調査番号" /> </xuni:FlexChart.AxisX> <xuni:FlexChart.AxisY> <xuni:ChartAxis TitleText="満足度スコア" Max="10"/> </xuni:FlexChart.AxisY> </xuni:FlexChart> </Grid> </StackLayout> </ContentPage>
手順 3:データを連結し、ゾーンを作成します
- SurveyZonesPage.xaml ノードを展開し、C# コードを開きます。
- 次の import 文を追加します。
C# コードのコピーusing System.Collections.ObjectModel; using Xamarin.Forms;
- 次のコードを SurveyZonesPage() クラスコンストラクタに追加して、チャートにゾーンを作成し、データラベルに NPS スコアを表示します。
C# コードのコピーpublic partial class SurveyZonesPage : ContentPage { public SurveyZonesPage() { InitializeComponent(); //顧客調査結果 int[] scores = { 8, 9, 9, 10, 3, 10, 6, 10, 7, 9 }; ObservableCollection<SurveyResult> results = new ObservableCollection<SurveyResult>(); chart.ItemsSource = results; Point[] zone1 = new Point[10]; Point[] zone2 = new Point[10]; Point[] zone3 = new Point[10]; ; Point[] threshold1 = new Point[10]; Point[] threshold2 = new Point[10]; //ゾーンとしきい値のポイントを設定します for (int i = 0; i < 10; i++) { results.Add(new SurveyResult(i, scores[i])); zone1[i] = new Point(i, 10); zone2[i] = new Point(i, 9); zone3[i] = new Point(i, 7); threshold1[i] = new Point(i, 9); threshold2[i] = new Point(i, 7); } //推奨者のゾーン 1 var seriesZone1 = new Xuni.Forms.FlexChart.ChartSeries(); seriesZone1.ItemsSource = zone1; seriesZone1.Binding = "Y"; seriesZone1.BindingX = "X"; seriesZone1.ChartType = Xuni.Forms.FlexChart.ChartType.Area; seriesZone1.Color = Color.FromHex("A3D9FF"); seriesZone1.Name = "推奨者"; //中立者のゾーン 2 var seriesZone2 = new Xuni.Forms.FlexChart.ChartSeries(); seriesZone2.ItemsSource = zone2; seriesZone2.Binding = "Y"; seriesZone2.BindingX = "X"; seriesZone2.ChartType = Xuni.Forms.FlexChart.ChartType.Area; seriesZone2.Color = Color.FromHex("96E6B3"); seriesZone2.Name = "中立者"; //批判者のゾーン 3 var seriesZone3 = new Xuni.Forms.FlexChart.ChartSeries(); seriesZone3.ItemsSource = zone3; seriesZone3.Binding = "Y"; seriesZone3.BindingX = "X"; seriesZone3.ChartType = Xuni.Forms.FlexChart.ChartType.Area; seriesZone3.Color = Color.FromHex("FCC989"); seriesZone3.Name = "批判者"; chart.Series.Add(seriesZone1); chart.Series.Add(seriesZone2); chart.Series.Add(seriesZone3); //推奨者のしきい値線 var seriesThreshold1 = new Xuni.Forms.FlexChart.ChartSeries(); seriesThreshold1.ItemsSource = threshold1; seriesThreshold1.Binding = "Y"; seriesThreshold1.BindingX = "X"; seriesThreshold1.Name = "推奨者のしきい値"; seriesThreshold1.ChartType = Xuni.Forms.FlexChart.ChartType.Line; seriesThreshold1.Color = Color.Olive; //中立者のしきい値線 var seriesThreshold2 = new Xuni.Forms.FlexChart.ChartSeries(); seriesThreshold2.ItemsSource = threshold2; seriesThreshold2.Binding = "Y"; seriesThreshold2.BindingX = "X"; seriesThreshold2.Name = "中立者のしきい値"; seriesThreshold2.ChartType = Xuni.Forms.FlexChart.ChartType.Line; seriesThreshold2.Color = Color.Maroon; chart.Series.Add(seriesThreshold1); chart.Series.Add(seriesThreshold2); //顧客満足度結果を追加します var satisfactionSeries = new Xuni.Forms.FlexChart.ChartSeries(chart, "満足度", "satisfaction"); satisfactionSeries.Color = Color.FromHex("F9F9F9"); chart.Series.Add(satisfactionSeries); lbl.Text = "NPS スコア " + GetNPS(scores).ToString(); } public double GetNPS(int[] scores) { double promoter = 0; double detractor = 0; foreach (int score in scores) { if (score >= 9) { promoter++; } else if (score < 7) { detractor++; } } double nps = ((promoter - detractor) / scores.Length) * 100; return nps; } }