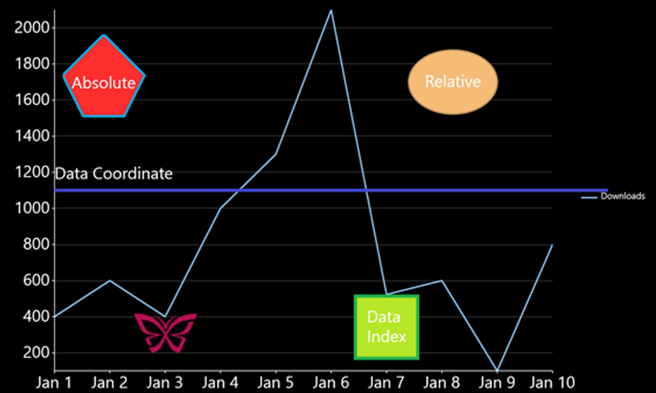
注釈は、重要なニュースまたはイベントをマークするために、FlexChart 上の特定のデータポイントにアタッチして使用されます。注釈は、画像、図形、テキストなどの任意の要素をチャート上に配置するためにも使用できます。Xuni FlexChart コントロールは、多角形、線、楕円、四角形、画像、テキストなどのさまざまな注釈が組み込まれています。
FlexChart 上の注釈の位置は、Position プロパティを Bottom、Center、Left、Right、または Top に設定することで指定できます。FlexChart で注釈の添付方法を指定するには Attachment プロパティを使用し、その値を次のように設定します。
- Absolute:注釈の座標は、注釈の図形データ(ピクセル単位)によって指定されます。
- DataCoordinate:注釈の座標は、データ座標で指定されます。
- DataIndex:注釈の座標は、データ系列インデックスとデータポイントインデックスによって指定されます。
- Relative:注釈の座標は、コントロール内の相対位置として指定されます。(0, 0) は左上隅、(1, 1) は右下隅を表します。
このトピックでは、FlexChart コントロールでさまざまなタイプの注釈を設定する方法を 3 つの手順で説明します。
次の図は、上記の手順を実行した後の FlexChart コントロールを示しています。

手順 1:FlexChart のデータソースの作成
- ソリューションエクスプローラーで、プロジェクト名(Portable app)を右クリックします。
- [追加]→[新しい項目]を選択します。[新しい項目の追加]ダイアログボックスが表示されます。
- ダイアログから[クラス]を選択し、SalesExpensesDownloadsEntity という名前を付けます。
- [追加]をクリックして、クラスをプロジェクトに追加します。
- SalesExpensesDownloadsEntity クラスに次のコードを追加します。
C# コードのコピーpublic class SalesExpensesDownloadsEntity { public string Name { get; set; } public double Sales { get; set; } public double Expenses { get; set; } public double Downloads { get; set; } public DateTime Date { get; set; } public SalesExpensesDownloadsEntity() { this.Name = string.Empty; this.Sales = 0; this.Expenses = 0; this.Downloads = 0; this.Date = DateTime.Now; } public SalesExpensesDownloadsEntity(string name, double sales, double expenses, double downloads, DateTime date) { this.Name = name; this.Sales = sales; this.Expenses = expenses; this.Downloads = downloads; this.Date = date; } }
手順 2:XAML での FlexChart コントロールの初期化と注釈の追加
- ソリューションエクスプローラーでプロジェクトを右クリックし、[追加|新しい項目]を選択します。[新しい項目の追加]ダイアログボックスが表示されます。
- インストール済みテンプレートから[Forms Xaml ページ]を選択して、Annotations という名前を付けます。
- [追加]をクリックして、ページをプロジェクトに追加します。
- Annotation.xaml ページに次の XAML コードを追加して FlexChart コントロールを初期化します。
XAML コードのコピー<ContentPage xmlns="http://xamarin.com/schemas/2014/forms" xmlns:x="http://schemas.microsoft.com/winfx/2009/xaml" xmlns:xuni="clr-namespace:Xuni.Forms.FlexChart;assembly=Xuni.Forms.FlexChart" xmlns:core="clr-namespace:Xuni.Forms.ChartCore;assembly=Xuni.Forms.ChartCore" x:Class="FlexChartAnnotations.Annotations"> <Label Text="{Binding MainText}" VerticalOptions="Center" HorizontalOptions="Center" /> <Grid VerticalOptions="FillAndExpand"> <xuni:FlexChart x:Name="flexChart" BindingX="Name" VerticalOptions="FillAndExpand" ChartType="Line" ItemsSource="{Binding ItemsSource}"> <xuni:FlexChart.Series> <xuni:ChartSeries Binding="Downloads" Name="Downloads" /> </xuni:FlexChart.Series> </xuni:FlexChart> </Grid> </ContentPage>
-
</xuni:FlexChart.Series> タグと </xuni:FlexChart> タグの間に次のコードを追加すると、FlexChart に注釈が追加されます。
XAML コードのコピー<xuni:FlexChart.Annotations> <core:ChartPolygonAnnotation x:Name="polygonAnnotation" Text="Absolute" Color="#FFFE2E2E" BorderColor="#FF01A9DB" BorderWidth="3"> <core:ChartPolygonAnnotation.Points> <Point X="60" Y="30"/> <Point X="10" Y="80"/> <Point X="35" Y="130"/> <Point X="85" Y="130"/> <Point X="110" Y="80"/> </core:ChartPolygonAnnotation.Points> </core:ChartPolygonAnnotation> <core:ChartEllipseAnnotation x:Name="ellipseAnnotation" Point="0.8,0.2" Width="110" Height="80" Text="Relative" Attachment="Relative" Color="#FFF5BC78" BorderColor="#FFC2955F" BorderWidth="2" /> <core:ChartLineAnnotation x:Name="lineAnnotation" Color="#FF3F48CC" LineWidth="4" Attachment="DataCoordinate" Start="{Binding PointStart}" End="{Binding PointEnd}"/> <core:ChartTextAnnotation x:Name="textAnnotation" Text="Data Coordinate" Attachment="DataCoordinate" Point="{Binding PointStart}" Position="Right" Offset="0,-20"/> <core:ChartImageAnnotation x:Name="imageAnnotation" Offset="0,20" Width="80" Height="80" PointIndex="2" Attachment="DataIndex" Source="{Binding ImageSource}" /> <core:ChartRectangleAnnotation x:Name="rectAnnotation" Width="80" Height="80" PointIndex="6" Position="Bottom" Attachment="DataIndex" Text="Data Index" Color="#FFB5E627" BorderColor="#FF22B14C" BorderWidth="4" /> </xuni:FlexChart.Annotations>
手順 3:コードでの連結処理の設定
- ソリューションエクスプローラーで、Annotations.xaml ノードを展開し、Annotations.xaml.cs を開いて、C# コードビハインドを開きます。
- 次のコードに示すように、Annotations() クラスコンストラクタで FlexChart の BindingContext を SampleViewModel に設定し、その他の注釈連結処理を設定します。
C# コードのコピーpublic partial class Annotations : ContentPage { public Annotations() { InitializeComponent(); this.flexChart.BindingContext = new SampleViewModel(); this.imageAnnotation.BindingContext = this.flexChart.BindingContext; this.lineAnnotation.BindingContext = this.flexChart.BindingContext; this.textAnnotation.BindingContext = this.flexChart.BindingContext; this.polygonAnnotation.TooltipText = "Polygon annotation\nPath=[60,30][10,80][35,130][85,130][110,80]\nAttachment=Absolute"; this.ellipseAnnotation.TooltipText = "Ellipse annotation\nPoint=0.8,0.2\nAttachment=Relative"; this.imageAnnotation.TooltipText = "Image annotation\nPointIndex=2\nAttachment=DataIndex"; this.rectAnnotation.TooltipText = "Rectangle annotation\nPointIndex=6\nAttachment=DataIndex"; } } public class SampleViewModel { List<SalesExpensesDownloadsEntity> itemsSource; double centerY; public SampleViewModel() { double[] downloads = { 400, 600, 400, 1000, 1300, 2100, 523, 600, 100, 800 }; this.itemsSource = new List<SalesExpensesDownloadsEntity>(); for (int i = 0; i < downloads.Length; i++) { itemsSource.Add(new SalesExpensesDownloadsEntity() { Downloads = downloads[i], Name = "Jan " + (i + 1) }); } centerY = (itemsSource.Max(x => x.Downloads) + itemsSource.Min(x => x.Downloads)) * 0.5; } public List<SalesExpensesDownloadsEntity> ItemsSource { get { return this.itemsSource; } } public ImageSource ImageSource { get { return ImageSource.FromResource("FlexChartAnnotations.Resources.xuni_butterfly.png"); } } public Point PointStart { get { return new Point(0, centerY); } } public Point PointEnd { get { return new Point(itemsSource.Count, centerY); } } }