系列(Series)のValuesプロパティで値のコレクションを参照し、DataSourceプロパティ、およびDataFieldプロパティを設定します。また、系列のCatagoryNamesプロパティで値の分類名のコレクションを参照し、DataSourceプロパティ、およびDataFieldプロパティを設定することで、値の分類名もデータソースから取得できます。
実行例:
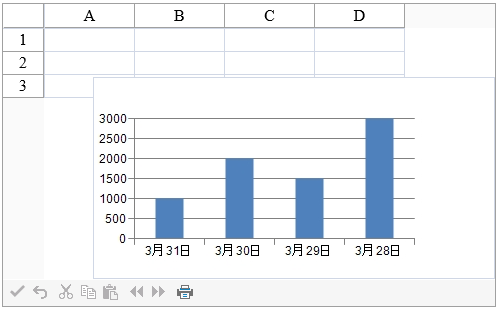
 |
チャートを表示するには、SPREADのHTTPハンドラを有効にする必要があります。設定方法については、「チャートのHTTPハンドラを登録する」を参照してください。 |
//データソースを生成します
System.Data.DataTable table = new System.Data.DataTable();
table.Columns.Add("Date");
table.Columns.Add("PageView");
table.Rows.Add(new object[] { DateTime.Today.AddDays(-1).ToString("M月d日"), 1000 });
table.Rows.Add(new object[] { DateTime.Today.AddDays(-2).ToString("M月d日"), 2000 });
table.Rows.Add(new object[] { DateTime.Today.AddDays(-3).ToString("M月d日"), 1500 });
table.Rows.Add(new object[] { DateTime.Today.AddDays(-4).ToString("M月d日"), 3000 });
//棒グラフにデータソースを連結します
FarPoint.Web.Chart.BarSeries barseries = new FarPoint.Web.Chart.BarSeries();
barseries.Values.DataSource = table;
barseries.Values.DataField = "PageView";
barseries.CategoryNames.DataSource = table;
barseries.CategoryNames.DataField = "Date";
//プロットエリアを作成します
FarPoint.Web.Chart.YPlotArea plots = new FarPoint.Web.Chart.YPlotArea()
{
    Location = new System.Drawing.PointF(0.1f, 0.2f),
    Size = new System.Drawing.SizeF(0.7f, 0.6f)
};
plots.Series.Add(barseries);
//チャートを作成し、プロットエリアを追加します
FarPoint.Web.Chart.ChartModel model = new FarPoint.Web.Chart.ChartModel();
model.PlotAreas.Add(plots);
FarPoint.Web.Spread.Chart.SpreadChart chart = new FarPoint.Web.Spread.Chart.SpreadChart()
{
    Model = model,
    Width = 400,
    Height = 200,
    Left = 50,
    Top = 50
};
FpSpread1.Sheets[0].Charts.Add(chart);
FpSpread1.ClientAutoSize = True
'データソースを生成します
Dim table As New System.Data.DataTable()
table.Columns.Add("Date")
table.Columns.Add("PageView")
table.Rows.Add(New Object() {DateTime.Today.AddDays(-1).ToString("M月d日"), 1000})
table.Rows.Add(New Object() {DateTime.Today.AddDays(-2).ToString("M月d日"), 2000})
table.Rows.Add(New Object() {DateTime.Today.AddDays(-3).ToString("M月d日"), 1500})
table.Rows.Add(New Object() {DateTime.Today.AddDays(-4).ToString("M月d日"), 3000})
'棒グラフにデータソースを連結します
Dim barseries As New FarPoint.Web.Chart.BarSeries()
barseries.Values.DataSource = table
barseries.Values.DataField = "PageView"
barseries.CategoryNames.DataSource = table
barseries.CategoryNames.DataField = "Date"
'プロットエリアを作成します
Dim plots As New FarPoint.Web.Chart.YPlotArea() With {
    .Location = New System.Drawing.PointF(0.1F, 0.2F),
    .Size = New System.Drawing.SizeF(0.7F, 0.6F)
}
plots.Series.Add(barseries)
'チャートを作成し、プロットエリアを追加します
Dim model As New FarPoint.Web.Chart.ChartModel()
model.PlotAreas.Add(plots)
Dim chart As New FarPoint.Web.Spread.Chart.SpreadChart() With {
    .Model = model,
    .Width = 400,
    .Height = 200,
    .Left = 50,
    .Top = 50
}
FpSpread1.Sheets(0).Charts.Add(chart)