ユーザーはセルに値と数式を同時に設定できます。また、セルの数式に基づいて、表示されるテキストに書式を設定できます。スタイルのフォーマッタに設定された書式文字列では、セルの表示値をカスタマイズする数式またはテキストテンプレートを指定できます。セル値はフォーマッタへのパラメータとして機能し、セル内で画像または更新したテキストとして描画されます。
スタイルのフォーマッタは、以下のように分かれています。
| フォーマッタ | 構文 | 例 |
|---|---|---|
| 標準のセル書式 | 標準のセル書式 |
"#,##0_);(#,##0)" "h:mm AM/PM" |
| 数式の書式文字列 | 標準の数式 |
"=SUM(@, C1)" "=AVERAGE(C4:C7)" |
| テキストテンプレートの書式文字列 | {{" "}}に数式が含まれるテキスト文字列 |
"After {{=@}} approval, Total Sales Were: {{=SUM(Sales4)}}" “Hello, @” |
「@」記号は現在のセル参照を表し、数式またはテキストテンプレートで直接使用できます。
書式文字列での数式
セル値を設定すると共に、式をスタイルのフォーマッタに設定できます。「@」記号を使用して、現在のセルはを数式で参照できます。
たとえば、セル値はA1:A2のセル範囲の合計として設定できます。
style.formatter = '=SUM(@, A1:A2)';
書式文字列でのテキストテンプレート
テキストテンプレートは、ダッシュボードを作成するやデータを要約する場合に役立ちます。テキストテンプレートを使用すると、テキストと数式を1つのセルに結合し、{{" and "}}内で指定して数式を文字列にを折り返すことができます。
たとえば、セルには、日の値、SUM関数、静的テキストを結合して表示することができます。
style.formatter = "On {{=TEXT(TODAY(),"DDDD")}}, Total Sales Were: ${{=SUM(A1:A5)}}.";
書式文字列は、次のシナリオで使用できます。
- 連結するより長い文字列を書式設定します。
- 基になる値を変更せずに、異なる通貨または単位で値を表示します。
- バーコードおよびスパークラインを使用して値または範囲をグラフィックスで描画します。
- 「数値を単語に変換する」機能を使用して数値を単語として表示します。
- ダッシュボードまたはレポートで値のKPI範囲テンプレートを表示します。
使用シナリオ
数値を単語に変更でき、その値はセルの値が変更されるたびに自動的に更新されます。
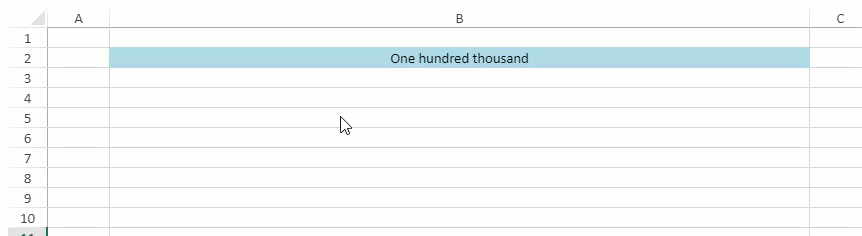
コードの使用
次のコードは、セル値に基づいて数値を単語として表示するためにカスタマイズされた関数を実装します。
| JavaScript |
コードのコピー
|
|---|---|
// スプレッドシートを初期化します。 var spread = new GC.Spread.Sheets.Workbook(document.getElementById('ss'), { sheetCount: 1 }); // 数値を単語に変換します。 var sheet1 = spread.getSheet(0); sheet1.name('Number to Words'); spread.addCustomName('n_1', '{"";" One";" Two";" Three";" Four";" Five";" Six";" Seven";" Eight";" Nine";" Ten";" Eleven";" Twelve";" Thirteen";" Fourteen";" Fifteen";" Sixteen";" Seventeen";" Eighteen";" Nineteen"}'); spread.addCustomName('n_2', '{"";0;" Twenty";" Thirty";" Forty";" Fifty";" Sixty";" Seventy";" Eighty";" Ninety"}'); spread.addCustomName('n_3', '{"";"-One";"-Two";"-Three";"-Four";"-Five";"-Six";"-Seven";"-Eight";"-Nine"}'); var numberToWordsStyle = new GC.Spread.Sheets.Style(); numberToWordsStyle.formatter = '=TRIM(REPT(INDEX(n_1,1+INT(@/10^8))&" hundred",10^8<@)&IF(@-TRUNC(@,-8)<2*10^7,INDEX(n_1,1+MID(TEXT(@,"000000000"),2,2)),INDEX(n_2,1+MID(TEXT(@,"000000000"),2,2)/10)&INDEX(n_3,1+RIGHT(INT(@/10^6))))&REPT(" million",10^6<@)&IF(--RIGHT(INT(@/10^5)),INDEX(n_1,1+RIGHT(INT(@/10^5)))&" hundred","")&IF(@-TRUNC(@,-5)<2*10^4,INDEX(n_1,1+MID(TEXT(@,"000000000"),5,2)),INDEX(n_2,1+MID(TEXT(@,"000000000"),5,2)/10)&INDEX(n_3,1+RIGHT(INT(@/10^3))))&IF(--MID(TEXT(@,"000000000"),4,3)," thousand","")&IF(--RIGHT(INT(@/100)),INDEX(n_1,1+RIGHT(INT(@/100)))&" hundred","")&IF(MOD(@,100)<20,INDEX(n_1,1+RIGHT(@,2)),INDEX(n_2,1+RIGHT(@,2)/10)&INDEX(n_3,1+RIGHT(@))))'; numberToWordsStyle.name = 'NumberToWords'; numberToWordsStyle.backColor = "lightblue"; spread.addNamedStyle(numberToWordsStyle); sheet1.setColumnWidth(1, 700); sheet1.setStyleName(1, 1, 'NumberToWords'); sheet1.getCell(1, 1).value(765348921).hAlign(GC.Spread.Sheets.HorizontalAlign.center); sheet1.setColumnWidth(1, 700); |
|
USD、CNY、JPY、およびEUROの通貨値をドロップダウン リストから選択することで、月次売上高をそれぞれの通貨で表示します。為替レートに基づいて、収益が毎月更新されます。また、為替レートが更新されるたびに、収益は動的に更新されます。
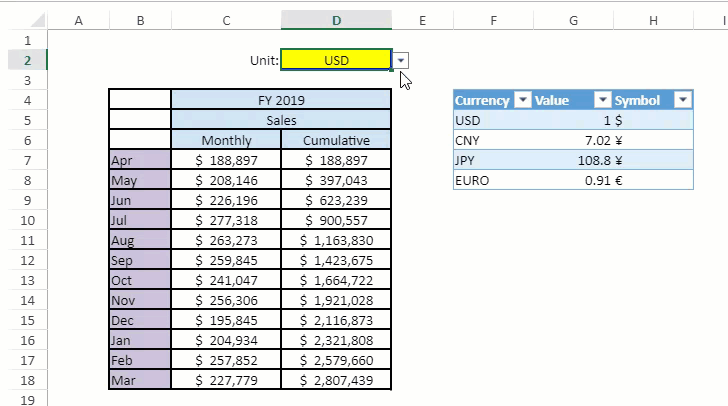
コードの使用
次のコードは、書式文字列を実装して、さまざまな通貨の為替レートに基づいて売上高を更新します。
| JavaScript |
コードのコピー
|
|---|---|
    var spread = new GC.Spread.Sheets.Workbook(document.getElementById('ss'), {
        sheetCount: 1
    });
    initSpread(spread);
};

function initSpread(spread) {
    var gcns = GC.Spread.Sheets;
    spread.suspendPaint();
    var sheet = spread.getActiveSheet();
    var data = [
        [, "FY 2019"],
        [, "Sales"],
        [, "Monthly", "Cumulative"],
        ["Apr", 188897, 188897],
        ["May", 208146, 397043],
        ["Jun", 226196, 623239],
        ["Jul", 277318, 900557],
        ["Aug", 263273, 1163830],
        ["Sep", 259845, 1423675],
        ["Oct", 241047, 1664722],
        ["Nov", 256306, 1921028],
        ["Dec", 195845, 2116873],
        ["Jan", 204934, 2321808],
        ["Feb", 257852, 2579660],
        ["Mar", 227779, 2807439]
    ];
    sheet.setArray(3, 1, data);
    sheet.setColumnWidth(2, 110);
    sheet.setColumnWidth(3, 110);
    sheet.setRowCount(20);
    sheet.setColumnCount(9);
    sheet.options.gridline.showHorizontalGridline = false;
    sheet.options.gridline.showVerticalGridline = false;
    sheet.getRange(3, 1, 15, 3).setBorder(
        new gcns.LineBorder("black", gcns.LineStyle.medium),
        { all: true });
    sheet.addSpan(3, 2, 1, 2);
    sheet.addSpan(4, 2, 1, 2);
    sheet.getRange(3, 2, 3, 2).backColor('#CFE1F3').hAlign(gcns.HorizontalAlign.center);
    sheet.getRange(6, 1, 12, 1).backColor('#CCC1DA');

    var cMapSource = [
        { "Currency": "USD", "Value": 1, "Symbol": "$" },
        { "Currency": "CNY", "Value": 7.02, "Symbol": "¥" },
        { "Currency": "JPY", "Value": 108.8, "Symbol": "¥" },
        { "Currency": "EURO", "Value": 0.91, "Symbol": "€" },
    ];
    sheet.tables.addFromDataSource('cT', 3, 5, cMapSource);
    [5, 6, 7].forEach((col) => { sheet.setColumnWidth(col, 80); });

    sheet.getCell(1, 2).value("Unit:").hAlign(gcns.HorizontalAlign.right);
    sheet.getRange(1, 3, 1, 1).backColor("yellow").setBorder(
        new gcns.LineBorder("blue", gcns.LineStyle.medium),
        { all: true });

    var dv1 = gcns.DataValidation.createFormulaListValidator('=cT[[#Data], [Currency]]');
    sheet.setDataValidator(1, 3, dv1);
    sheet.getCell(1, 3).hAlign(gcns.HorizontalAlign.center).value("USD");

    sheet.getRange(6, 2, 12, 2)
        .hAlign(gcns.HorizontalAlign.center)
        .formatter('=VLOOKUP($D$2,cT[#Data],3,FALSE)&"  "&TEXT(@*VLOOKUP($D$2,cT[#Data],2,FALSE),"###,###")');
    spread.resumePaint();
|
|
現在のKPIを示すためにゲージを表示します。カスタマイズされた関数は、スタイルのフォーマッタに設定されるゲージKPIスパークラインを表します。radiusRatio、targetValue、label marginBottomなどのさまざまなパラメータを変更して、ゲージKPIスパークラインの動的な変化を確認できます。
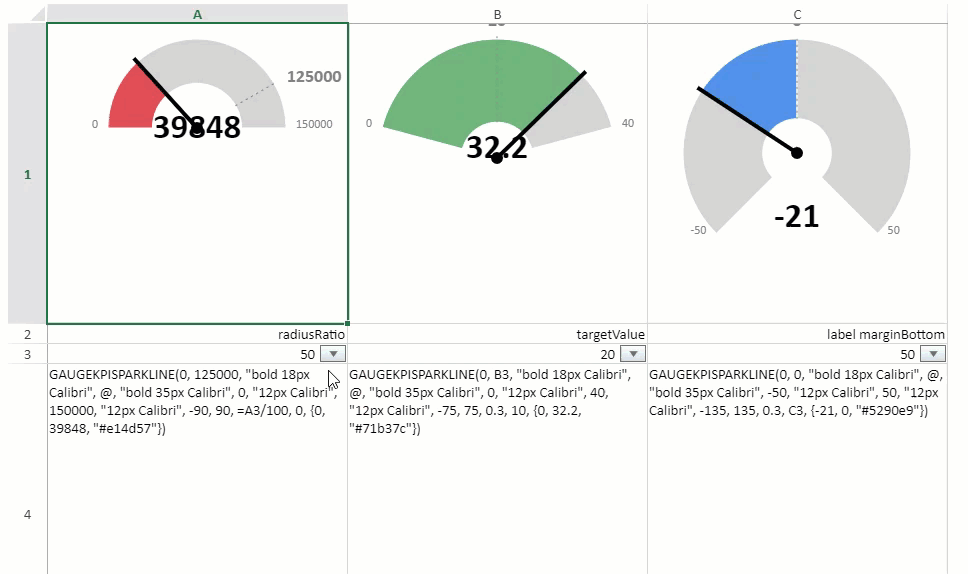
コードの使用
次のコードは、、セルの値に基づいてKPIゲージの値を更新するために書式文字列を実装します。
| JavaScript |
コードのコピー
|
|---|---|
<script>
    var GuageKPIType = {
        circle: 0,
        verticalBar: 1,
        horizontalBar: 2
    };

    function getFontHeight(font) {
        var htmlSpan = document.createElement('span');
        htmlSpan.style.font = font;
        htmlSpan.innerHTML = 'H';
        var fontHeight = htmlSpan.offsetHeight;
        return fontHeight;
    }

    function GaugeKPISparkline() {
        GC.Spread.Sheets.Sparklines.SparklineEx.call(this);
        this.CIRCLE_CENTER_RADIUS = 6;
        this.TARGET_VALUE_INCREMENT = 3;
        this.CURRENT_VALUE_INCREMENT = 5;
        this.CURRENT_VALUE_LINE_WIDTH = 4;
        this.DASH_LINE_SOLID_LENGTH = 2;
        this.DASH_LINE_EMPTY_LENGTH = 4;
        this.TEXT_MARGIN = 10;
        this.PAINT_PADDING = 6;
    }
    GaugeKPISparkline.prototype = new GC.Spread.Sheets.Sparklines.SparklineEx();
    GaugeKPISparkline.prototype.createFunction = function () {
        var functionDescription = {
            description: 'この関数は、ゲージKPIスパークラインを表すために使用されるデータセットを返します。',
            parameters: [
                {
                    name: 'gaugeType'
                },
                {
                    name: 'targetValue'
                },
                {
                    name: 'targetValueFont'
                },
                {
                    name: 'currentValue'
                },
                {
                    name: 'currentValueFont'
                },
                {
                    name: 'minValue'
                },
                {
                    name: 'minValueFont'
                },
                {
                    name: 'maxValue'
                },
                {
                    name: 'maxValueFont'
                },
                {
                    name: 'minAngle'
                },
                {
                    name: 'maxAngle'
                },
                {
                    name: 'radiusRatio'
                },
                {
                    name: 'marginBottom'
                },
                {
                    name: 'colorRange'
                },
                {
                    name: '...'
                }
            ]
        };
        var func = new GC.Spread.CalcEngine.Functions.Function("GAUGEKPISPARKLINE", 5, 15, functionDescription);
        func.evaluate = function (args) {
            var retValue = {
                gaugeType: args[0],
                targetValue: args[1],
                targetValueFont: args[2],
                currentValue: args[3],
                currentValueFont: args[4],
                minValue: args[5],
                minValueFont: args[6],
                maxValue: args[7],
                maxValueFont: args[8],
                minAngle: args[9],
                maxAngle: args[10],
                radiusRatio: args[11],
                marginBottom: args[12]
            };
            var ranges = [], argsLength = args.length, tempArray;
            for (var index = 13; index < argsLength; index++) {
                var rangeValue = args[index];
                if (rangeValue instanceof GC.Spread.CalcEngine.CalcArray) {
                    tempArray = rangeValue.array[0];
                    ranges.push({
                        start: tempArray[0],
                        end: tempArray[1],
                        color: tempArray[2]
                    });
                }
            }
            retValue.ranges = ranges;
            return retValue;
        };
        func.acceptsArray = function (argIndex) {
            return argIndex >= 9 || argIndex >= 1 && argIndex <= 4;
        };
        return func;
    };
    GaugeKPISparkline.prototype.paint = function (ctx, value, x, y, width, height, options) {
        if (!value) {
            return;
        }
        if (value.gaugeType === GuageKPIType.circle) {
            ctx.save();
            ctx.rect(x, y, width, height);
            ctx.clip();
            this.paintCircle(ctx, value, x, y, width, height, options);
            ctx.restore();
        }
    };
    GaugeKPISparkline.prototype.getCircleData = function (ctx, value, x, y, width, height, options) {
        var zoomFactor = options.zoomFactor;
        var currentValueHeight = getFontHeight(value.currentValueFont) * zoomFactor,
            targetValueHeight = getFontHeight(value.targetValueFont) * zoomFactor;
        var PAINT_PADDING = this.PAINT_PADDING, TEXT_MARGIN = this.TEXT_MARGIN;
        var minAngle = value.minAngle, maxAngle = value.maxAngle;
        var minValueWidth = Math.ceil(ctx.measureText(value.minValue).width),
            maxValueWidth = Math.ceil(ctx.measureText(value.maxValue).width);
        var textWidth = Math.max(minValueWidth, maxValueWidth);
        var xOuterRadius = Math.floor(width / 2 - PAINT_PADDING - TEXT_MARGIN - textWidth);
        var graphHeight = Math.floor(height - PAINT_PADDING * 2 - TEXT_MARGIN * 2 - currentValueHeight - targetValueHeight),
            moreThanSemiCircle = Math.abs(minAngle) > 90 || Math.abs(maxAngle) > 90;
        var yOuterRadius = moreThanSemiCircle ? graphHeight / 2 : graphHeight;
        var outerRadius = Math.min(xOuterRadius, yOuterRadius);
        var retValue = {
            x: x + PAINT_PADDING + textWidth + TEXT_MARGIN + outerRadius,
            y: y + PAINT_PADDING + targetValueHeight + TEXT_MARGIN + outerRadius,
            outerRadius: outerRadius,
            innerRadius: outerRadius * value.radiusRatio
        };
        retValue.currentValuePoint = {
            x: retValue.x,
            y: moreThanSemiCircle ? (retValue.y + outerRadius + TEXT_MARGIN + currentValueHeight) : (retValue.y + TEXT_MARGIN + currentValueHeight)
        };
        return retValue;
    };
    GaugeKPISparkline.prototype.getPaintData = function (value) {
        var minRadian = (value.minAngle - 90) * Math.PI / 180, maxRadian = (value.maxAngle - 90) * Math.PI / 180;
        var minValue = value.minValue, maxValue = value.maxValue;
        var colorRanges = value.ranges, fillColor = 'lightgrey';
        var valuePerRadian = (maxRadian - minRadian) / (maxValue - minValue);
        var paintRanges = [];
        if (colorRanges.length > 0) {
            colorRanges.forEach(function (colorRange) {
                paintRanges.push({
                    start: valuePerRadian * (colorRange.start - minValue) + minRadian,
                    end: valuePerRadian * (colorRange.end - minValue) + minRadian,
                    color: colorRange.color
                });
            });
            paintRanges.unshift({ start: minRadian, end: paintRanges[0].start, color: fillColor });
            paintRanges.push({ start: paintRanges[paintRanges.length - 1].end, end: maxRadian, color: fillColor });
        } else {
            paintRanges.push({ start: minRadian, end: maxRadian, color: fillColor });
        }
        return {
            paintRanges: paintRanges,
            fillColor: fillColor,
            targetValueRadian: valuePerRadian * (value.targetValue - minValue) + minRadian,
            currentValueRadian: valuePerRadian * (value.currentValue - minValue) + minRadian,
            minValueRadian: minRadian,
            maxValueRadian: maxRadian
        };
    };
    GaugeKPISparkline.prototype.getPointOnCircle = function (x, y, radian, radius) {
        return {
            x: x + Math.cos(radian) * radius,
            y: y + Math.sin(radian) * radius
        };
    };
    GaugeKPISparkline.prototype.getCircleValuePaintInfo = function (circleCenterPoint, targetValuePoint, targetValueWidth) {
        var TEXT_MARGIN = this.TEXT_MARGIN;
        // 文字の高さを設定します。
        if (targetValuePoint.x > circleCenterPoint.x) {
            return { x: targetValuePoint.x + TEXT_MARGIN, y: targetValuePoint.y, textAlign: 'left' };
        }
        if (targetValuePoint.x < circleCenterPoint.x) {
            return { x: targetValuePoint.x - TEXT_MARGIN, y: targetValuePoint.y, textAlign: 'right' };
        }
        if (targetValuePoint.x === circleCenterPoint.x) {
            if (targetValuePoint.y > circleCenterPoint.y) {
                return { x: targetValuePoint.x, y: targetValuePoint.y + TEXT_MARGIN, textAlign: 'center' };
            }
            return { x: targetValuePoint.x, y: targetValuePoint.y - TEXT_MARGIN, textAlign: 'center' };
        }
        return { x: targetValuePoint.x, y: targetValuePoint.y, textAlign: 'left' };
    };
    GaugeKPISparkline.prototype.paintCircle = function (ctx, value, x, y, width, height, options) {
        var zoomFactor = options.zoomFactor;
        var circleData = this.getCircleData(ctx, value, x, y, width, height, options);
        var innerRadius = circleData.innerRadius, outerRadius = circleData.outerRadius;
        if (outerRadius <= 0) {
            return;
        }
        var currentValuePoint = circleData.currentValuePoint;
        var circleCenter = { x: circleData.x, y: circleData.y };
        var paintData = this.getPaintData(value),
            paintRanges = paintData.paintRanges, fillColor = paintData.fillColor;

        ctx.save();

        // <editor-folder desc="paint circles">
        paintRanges.forEach(function (paintRange) {
            // 外側の円を描きます。
            ctx.beginPath();
            ctx.moveTo(circleCenter.x, circleCenter.y);
            ctx.fillStyle = paintRange.color || fillColor;
            ctx.strokeStyle = 'white';
            ctx.arc(circleCenter.x, circleCenter.y, outerRadius, paintRange.start, paintRange.end, false);
            ctx.closePath();
            ctx.fill();
            ctx.stroke();

            // 内側の円を描きます。
            ctx.beginPath();
            ctx.moveTo(circleCenter.x, circleCenter.y);
            ctx.fillStyle = 'white';
            ctx.strokeStyle = 'white';
            ctx.arc(circleCenter.x, circleCenter.y, innerRadius, paintRange.start, paintRange.end, false);
            ctx.closePath();
            ctx.fill();
            ctx.stroke();
        });
        // </editor-folder>

        // <editor-folder desc="paint circle center">
        ctx.beginPath();
        ctx.moveTo(circleCenter.x, circleCenter.y);
        ctx.fillStyle = 'black';
        ctx.arc(circleCenter.x, circleCenter.y, this.CIRCLE_CENTER_RADIUS, 0, 2 * Math.PI, false);
        ctx.fill();
        // </editor-folder>

        // <editor-folder desc="paint line">
        // <editor-folder desc="paint target value line">
        var targetValueInnerPointOnCircle = this.getPointOnCircle(circleCenter.x, circleCenter.y, paintData.targetValueRadian, innerRadius);
        var targetValueOuterPointOnCircle = this.getPointOnCircle(circleCenter.x, circleCenter.y, paintData.targetValueRadian, outerRadius + this.TARGET_VALUE_INCREMENT);
        ctx.save();
        ctx.beginPath();
        ctx.setLineDash([this.DASH_LINE_SOLID_LENGTH, this.DASH_LINE_EMPTY_LENGTH]);
        ctx.moveTo(targetValueInnerPointOnCircle.x, targetValueInnerPointOnCircle.y);
        ctx.strokeStyle = 'grey';
        ctx.lineTo(targetValueOuterPointOnCircle.x, targetValueOuterPointOnCircle.y);
        ctx.stroke();
        ctx.restore();
        // </editor-folder>

        // <editor-folder desc="paint current value line">
        var currentValuePointOnCircle = this.getPointOnCircle(circleCenter.x, circleCenter.y, paintData.currentValueRadian, outerRadius + this.CURRENT_VALUE_INCREMENT);
        ctx.beginPath();
        ctx.strokeStyle = 'black';
        ctx.lineWidth = this.CURRENT_VALUE_LINE_WIDTH;
        ctx.moveTo(circleCenter.x, circleCenter.y);
        ctx.lineTo(currentValuePointOnCircle.x, currentValuePointOnCircle.y);
        ctx.stroke();
        // </editor-folder>
        // </editor-folder>

        // <editor-folder desc="paint value">
        ctx.save();
        ctx.beginPath();
        ctx.textAlign = "start";
        ctx.fillStyle = 'grey';
        var minValueHeight = getFontHeight(value.minValueFont) * zoomFactor,
            maxValueHeight = getFontHeight(value.maxValueFont) * zoomFactor;
        var minMaxValueHeight = Math.floor(Math.max(minValueHeight, maxValueHeight));
        // <editor-folder desc="paint min value">
        var minValueFont = value.minValueFont || '10px Calibri';
        ctx.font = minValueFont;
        var minValue = value.minValue + '';
        var minValueWidth = ctx.measureText(minValue).width;
        var minValuePointOnCircle = this.getPointOnCircle(circleCenter.x, circleCenter.y, paintData.minValueRadian, outerRadius);
        var minValueInfo = this.getCircleValuePaintInfo(circleCenter, minValuePointOnCircle, minValueWidth);
        ctx.textAlign = minValueInfo.textAlign;
        ctx.fillText(minValue, minValueInfo.x, minValueInfo.y + minMaxValueHeight / 2);
        // </editor-folder>

        // <editor-folder desc="paint max value">
        var maxValueFont = value.maxValueFont || '30px Calibri';
        ctx.font = maxValueFont;
        var maxValue = value.maxValue + '';
        var maxValueWidth = ctx.measureText(maxValue).width;
        var maxValuePointOnCircle = this.getPointOnCircle(circleCenter.x, circleCenter.y, paintData.maxValueRadian, outerRadius);
        var maxValueInfo = this.getCircleValuePaintInfo(circleCenter, maxValuePointOnCircle, maxValueWidth);
        ctx.textAlign = maxValueInfo.textAlign;
        ctx.fillText(maxValue, maxValueInfo.x, maxValueInfo.y + minMaxValueHeight / 2);
        // </editor-folder>

        // <editor-folder desc="paint target value">
        var targetValueFont = value.targetValueFont || '16.667px Calibri';
        ctx.font = targetValueFont;
        var targetValue = value.targetValue + '';
        var targetValueWidth = ctx.measureText(targetValue).width;
        var targetValueInfo = this.getCircleValuePaintInfo(circleCenter, targetValueOuterPointOnCircle, targetValueWidth);
        ctx.textAlign = targetValueInfo.textAlign;
        ctx.fillText(targetValue, targetValueInfo.x, targetValueInfo.y);
        ctx.restore();
        // </editor-folder>

        // <editor-folder desc="paint current value">
        ctx.save();
        ctx.beginPath();
        var currentValueFont = value.currentValueFont || "25px Calibri";
        ctx.font = currentValueFont;
        var currentValue = value.currentValue + '';
        ctx.textAlign = "center";
        ctx.fillText(currentValue, currentValuePoint.x, currentValuePoint.y - value.marginBottom);
        ctx.restore();
        // </editor-folder>
        // </editor-folder>

        ctx.restore();
    };
    GaugeKPISparkline.prototype.paintHorizontalBar = function (ctx, value, x, y, width, height) {
        // ...
    };
    GaugeKPISparkline.prototype.paintVerticalBar = function (ctx, value, x, y, width, height) {
        // ...
    };
</script>
<script>
    $(document).ready(function () {
        // スプレッドシートを初期化します。
        var spread = new GC.Spread.Sheets.Workbook(document.getElementById('ss'), { sheetCount: 1 });
        // KPIゲージ
        var sheet1 = spread.getSheet(0);
        sheet1.name('KPI Gauge');
        spread.addSparklineEx(new GaugeKPISparkline());
        sheet1.suspendPaint();
        sheet1.setRowHeight(0, 300);
        sheet1.setColumnWidth(0, 300);
        sheet1.setColumnWidth(1, 300);
        sheet1.setColumnWidth(2, 300);
        sheet1.setRowCount(4);
        sheet1.setRowHeight(3, 300);
        sheet1.setColumnCount(3);
        sheet1.getCell(1, 0).text("radiusRatio").hAlign(2);
        sheet1.getCell(1, 1).text("targetValue").hAlign(2);
        sheet1.getCell(1, 2).text("label marginBottom").hAlign(2);
        var radiusRatioSliderStyle = new GC.Spread.Sheets.Style();
        radiusRatioSliderStyle.cellButtons = [{
            imageType: GC.Spread.Sheets.ButtonImageType.dropdown,
            command: "openSlider",
            useButtonStyle: true,
        }];
        radiusRatioSliderStyle.dropDowns = [{
            type: GC.Spread.Sheets.DropDownType.slider,
            option: {
                marks: [0, 50, 100],
                step: 1,
                width: 190,
                direction: GC.Spread.Sheets.LayoutDirection.horizontal,
            }
        }];
        var targetValueSliderStyle = new GC.Spread.Sheets.Style();
        targetValueSliderStyle.cellButtons = [{
            imageType: GC.Spread.Sheets.ButtonImageType.dropdown,
            command: "openSlider",
            useButtonStyle: true,
        }];
        targetValueSliderStyle.dropDowns = [{
            type: GC.Spread.Sheets.DropDownType.slider,
            option: {
                max: 40,
                marks: [0, 20, 40],
                step: 1,
                width: 190,
                direction: GC.Spread.Sheets.LayoutDirection.horizontal,
            }
        }];
        var marginBottomSliderStyle = new GC.Spread.Sheets.Style();
        marginBottomSliderStyle.cellButtons = [{
            imageType: GC.Spread.Sheets.ButtonImageType.dropdown,
            command: "openSlider",
            useButtonStyle: true,
        }];
        marginBottomSliderStyle.dropDowns = [{
            type: GC.Spread.Sheets.DropDownType.slider,
            option: {
                max: 50,
                marks: [0, 25, 50],
                step: 1,
                width: 190,
                direction: GC.Spread.Sheets.LayoutDirection.horizontal,
            }
        }];
        sheet1.setStyle(2, 0, radiusRatioSliderStyle);
        sheet1.setValue(2, 0, 50);
        sheet1.setStyle(2, 1, targetValueSliderStyle);
        sheet1.setValue(2, 1, 20);
        sheet1.setStyle(2, 2, marginBottomSliderStyle);
        sheet1.setValue(2, 2, 50);
        var style1 = new GC.Spread.Sheets.Style();
        style1.formatter =
            '=GAUGEKPISPARKLINE(0, 125000, "bold 18px Calibri", @, "bold 35px Calibri", 0, "12px Calibri", 150000, "12px Calibri", -90, 90, =A3/100, 0, {0, 39848, "#e14d57"})';
        sheet1.setStyle(0, 0, style1);
        sheet1.setValue(0, 0, 39848);
        sheet1.getCell(3, 0).value(style1.formatter.substr(1, style1.formatter.length - 1)).wordWrap(true);
        var style2 = new GC.Spread.Sheets.Style();
        style2.formatter =
            '=GAUGEKPISPARKLINE(0, B3, "bold 18px Calibri", @, "bold 35px Calibri", 0, "12px Calibri", 40, "12px Calibri", -75, 75, 0.3, 10, {0, 32.2, "#71b37c"})';
        sheet1.setStyle(0, 1, style2);
        sheet1.setValue(0, 1, 32.2);
        sheet1.getCell(3, 1).value(style2.formatter.substr(1, style2.formatter.length - 1)).wordWrap(true);
        var style3 = new GC.Spread.Sheets.Style();
        style3.formatter =
            '=GAUGEKPISPARKLINE(0, 0, "bold 18px Calibri", @, "bold 35px Calibri", -50, "12px Calibri", 50, "12px Calibri", -135, 135, 0.3, C3, {-21, 0, "#5290e9"})';
        sheet1.setStyle(0, 2, style3);
        sheet1.setValue(0, 2, -21);
        sheet1.getCell(3, 2).value(style3.formatter.substr(1, style3.formatter.length - 1)).wordWrap(true);
        sheet1.resumePaint();
    });
</script>
|
|
注:以下は、制限事項となります。
- Excelでは書式文字列がサポートされていないので、Excel I/Oがサポートされていません。
- 書式文字列はセルの状態をサポートしていません。