Wijmo UI for the Web
曲線回帰の追加
| Wijmo ユーザーガイド > ウィジェット > Chart ウィジェット > CompositeChart > 操作手順 > 曲線回帰の追加 |
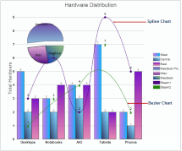
クイックスタートの例に基づいて、曲線回帰を追加するには、データ系列の種類を折れ線グラフの代わりにスプラインやベジェグラフとして設定できます。
ドロップダウンからコードをコピーします
| グリッド線を表示するスクリプト |
コードのコピー |
|---|---|
<script id="scriptInit" type="text/javascript">
    $(document).ready(function () {
    $("#wijcompositechart").wijcompositechart({
        axis: {y: {text: "Total Hardware"}},
        hint: {
            content: function () {return this.label + '\n ' + this.y + '';}
            },
        header: {text: "Hardware Distribution"},
        seriesList: [{
            type: "column",
            label: "West",
            data: {
                x: ['Desktops', 'Notebooks', 'AIO', 'Tablets', 'Phones'],
                y: [5, 3, 4, 7, 2] }
        },
        {
            type: "column",
            label: "Central",
            data: {
                x: ['Desktops', 'Notebooks', 'AIO', 'Tablets', 'Phones'],
                y: [2, 2, 3, 2, 1] }
        },
        {
            type: "column",
            label: "East",
            data: {
                x: ['Desktops', 'Notebooks', 'AIO', 'Tablets', 'Phones'],
                y: [3, 4, 4, 2, 5] }
        },
        {
            type: "pie",
            center: { x: 150, y: 150 },
            radius: 60,
            data: [
                {label: "MacBook Pro",data: 46.78},
                {label: "iMac", data: 23.18},
                {label: "MacBook", data: 20.25}
                ]
        },
        {
            type: "spline",
            label: "Steam1",
            data: {
                x: ['Desktops', 'Notebooks', 'AIO', 'Tablets', 'Phones'],
                y: [3, 6, 2, 9, 5]
            },
            markers: {visible: true, type: "box"}
        },
        {
            type: "bezier",
            label: "Steam2",
            data: {
                x: ['Desktops', 'Notebooks', 'AIO', 'Tablets', 'Phones'],
                y: [1, 3, 4, 7, 2]
            },
            markers: {visible: true, type: "diamond"}
        }]
    });
  });
</script>
| |

曲線回帰を含むグラフ |