Wijmo UI for the Web
マーカーの変更
| Wijmo ユーザーガイド > ウィジェット > Chart ウィジェット > ScatterChart > 操作手順 > マーカーの変更 |
クイックスタートの例に基づき、seriesList オプションと seriesStyles オプションを使用して、マーカーとマーカーの色を変更できます。
ドロップダウンからスクリプトをコピーして、<head> セクション内に貼り付けます
| スクリプト |
コードのコピー |
|---|---|
<script id="scriptInit" type="text/javascript"> $(document).ready(function () { $("#wijscatterchartDefault").wijscatterchart({ header: {text: "Height Versus Weight of 72 Individuals by Gender"}, axis: { y: { text: "Weight (kg)", labels: { style: {fill: "#7f7f7f", "font-size": "11pt"} }, gridMajor: { style: { stroke: "#353539", "stroke-dasharray": "- " } }, tickMajor: { position: "outside", style: { stroke: "#7f7f7f"} }, tickMinor: { position: "outside", style: { stroke: "#7f7f7f"}} }, x: { text: "Height (cm)", labels: { style: {fill: "#7f7f7f", "font-size": "11pt", rotation: -45} }, tickMajor: { position: "outside", style: { stroke: "#7f7f7f"}} } }, hint: { content: function () { return this.x + ' cm, ' + this.y + ' kg' }, contentStyle: {"font-size": "10pt"}, offsetY: -10 }, seriesList: [ { label: "Female", data: { x: [161.4, 169.0, 166.2, 159.4, 162.5, 159.0, 162.8, 159.0, 179.8, 162.9, 161.0, 151.1, 168.2, 168.9, 173.2, 174.0, 162.6, 174.0, 162.6, 161.3, 156.2, 149.9, 169.5, 160.0, 175.3, 169.5, 160.0, 172.7, 162.6, 157.5, 176.5, 164.4, 160.7, 174.0, 163.8], y: [63.4, 58.2, 58.6, 45.7, 52.2, 48.6, 57.8, 55.6, 66.8, 59.4, 53.6, 73.2, 53.4, 69.0, 58.4, 73.6, 61.4, 55.5, 63.6, 60.9, 60.0, 46.8, 57.3, 64.1, 63.6, 67.3, 75.5, 68.2, 61.4, 76.8, 71.8, 55.5, 48.6, 66.4, 67.3] }, markerType: "cross" }, { label: "Male", data: { x: [175.0, 174.0, 165.1, 177.0, 192.0, 176.5, 169.4, 182.1, 179.8, 175.3, 184.9, 177.3, 167.4, 178.1, 168.9, 174.0, 167.6, 170.2, 167.6, 188.0, 174.0, 176.5, 180.3, 167.6, 188.0, 180.3, 167.6, 183.0, 183.0, 179.1, 170.2, 177.8, 179.1, 190.5, 177.8, 180.3, 180.3], y: [70.2, 73.4, 70.5, 68.9, 102.3, 68.4, 65.9, 75.7, 84.5, 87.7, 86.4, 73.2, 53.9, 72.0, 55.5, 70.9, 64.5, 77.3, 72.3, 87.3, 80.0, 82.3, 73.6, 74.1, 85.9, 73.2, 76.3, 65.9, 90.9, 89.1, 62.3, 82.7, 79.1, 98.2, 84.1, 83.2, 83.2] }, markerType: "circle" } ], seriesStyles: [ {fill: "deeppink", stroke: "deeppink"}, {fill: "cornflowerblue", stroke: "cornflowerblue"} ] }); }); </script> | |
 |
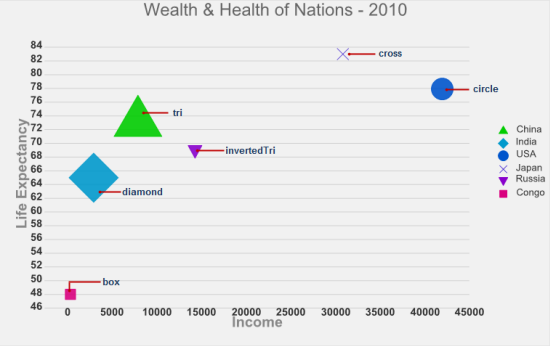
メモ:seriesList オプションで、データ系列ごとに異なるマーカータイプを使用するように設定できます。使用可能なマーカータイプは box、circle、cross、diamond、invertedTri、および tri です。 次の画像の BubbleChart は、使用可能なマーカーを示します。 |
