Wijmo UI for the Web
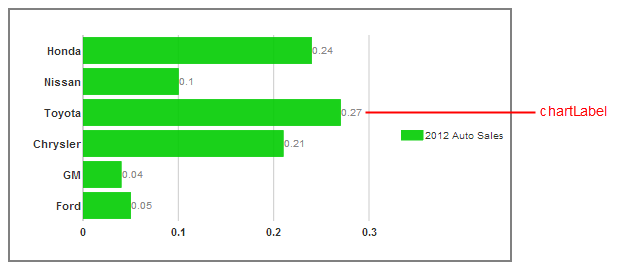
showChartLabels オプション
| wijmo.chart.wijchartcore 名前空間 > options タイプ : showChartLabels オプション |
各チャート要素の値を含むラベルを表示するかどうかを示す値。
型: Boolean
デフォルト値: true
| Javascript (Usage) | |
|---|---|
$(function () { //値を取得する var returnsValue; //タイプ: boolean returnsValue = $(".selector").wijchartcore("option", "showChartLabels"); //値を設定します var newValue; //タイプ: boolean $(".selector").wijchartcore("option", "showChartLabels", newValue); }); | |
| Javascript (Specification) | |
|---|---|
var showChartLabels : boolean; | |
以下のサンプルは、同じチャートをラベルなしで表示します。
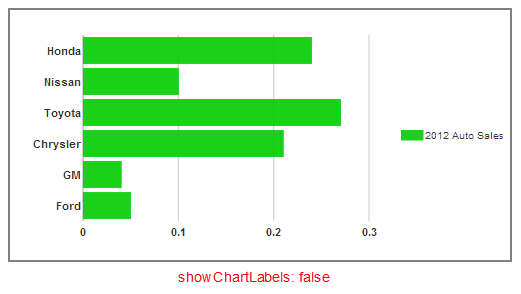
<script id="scriptInit" type="text/javascript">
    $(document).ready(function () {
        $("#wijbarchart").wijbarchart({
            showChartLabels: false,
            seriesList: [{
                label: "2012 Auto Sales",
                data: {
                    x: ['Ford', 'GM', 'Chrysler', 'Toyota', 'Nissan', 'Honda'],
                    y: [.05, .04, .21, .27, .1, .24]
                }
            }],
    });
});
</script>