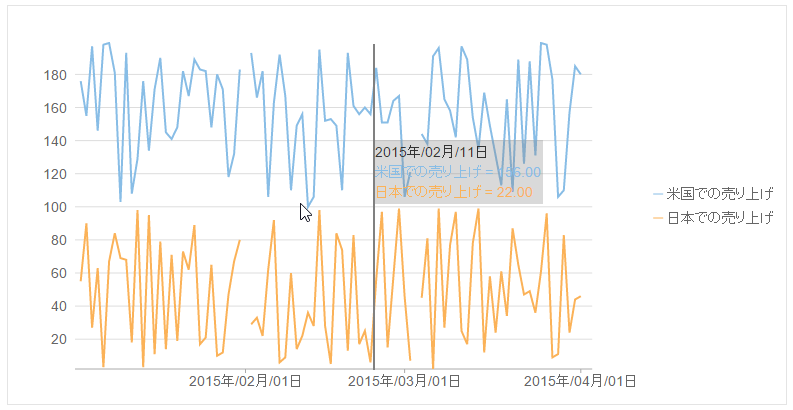
マーカーは、データ系列上にマウスホバーした際、データポイントの値を示す記号です。FlexChart にて、AddLineMarker メソッドを使用してラインマーカーを追加することができます。また、LineMarkersLines プロパティを以下の値のいずれかに設定できます:
- Vertical:縦ラインマーカーが表示されます。
- Horizontal:横ラインマーカが表示されます。
- Both:縦および横ラインマーカーの両方が表示されます。
- None: ラインマーカが表示されません。
次の図は、グラフ上にデータポイントを表示するため、内容付き縦ラインマーカーを示しています。

次のコード例では、FlexChart に内容付き縦ラインマーカを追加する方法を示します。この例では、「クイックスタート」セクションで作成したサンプルを使用します。
| HTML |
コードのコピー
|
|---|---|
@using C1.Web.Mvc.Chart; @using TagFlexGrid.Models; <script type="text/javascript"> function lineMarkerContent(hitInfo, pt) { var html = '', chart = hitInfo.series ? hitInfo.series.chart : undefined; if (!chart || !chart.series) { return html; } chart.series.forEach(function (s, i) { var ht = s.hitTest(new wijmo.Point(pt.x, NaN)), hostEle = s.hostElement, polyline; polyline = s.hostElement ? s.hostElement.getElementsByTagName("polyline")[0] : undefined; if (polyline && ht.x && ht.y !== null) { if (i == 0) { html += wijmo.Globalize.formatDate(ht.x, 'dd-MMM'); } html += '<div style="color:' + polyline.getAttribute('stroke') + '">' + ht.name + ' = ' + ht.y.toFixed(2) + '</div>'; } }); return html; } </script> <c1-flex-chart binding-x="Date" chart-type="ChartType.Line" width="780px" interpolate-nulls="true"> <c1-items-source source-collection="Model"></c1-items-source> <c1-flex-chart-series binding="SalesInUSA" name="米国での売り上げ"></c1-flex-chart-series> <c1-flex-chart-series binding="SalesInJapan" name="日本での売り上げ" ></c1-flex-chart-series> <c1-flex-chart-axis c1-property="AxisX" format="dd-MMM"></c1-flex-chart-axis> <c1-flex-chart-tooltip content=""></c1-flex-chart-tooltip> <c1-line-marker alignment="LineMarkerAlignment.Auto" lines="LineMarkerLines.Vertical" drag-content="true" interaction="LineMarkerInteraction.Move" content="lineMarkerContent"> </c1-line-marker> </c1-flex-chart> |
|