The FlexReport control provides the RadarChartField field type for displaying radar charts in reports. You can use the FlexReportDesigner to add radar charts and configure their properties.
Radar charts display multiple data series across a shared set of categories on a radial axis. They are useful for comparing groups of values across several characteristics or dimensions.
Bind RadarChartField to Data
After adding a RadarChartField to a report, bind it to a data source to display data in the report output.
The following example uses the SalesByQuarter table from the C1Nwind.mdb database.
Step 1: Create a Report and Bind the Data Source
- Create a new report in FlexReportDesigner.
- In the Data tab, bind the Main data source to the SalesByQuarter table from the C1Nwind.mdb database.
For detailed data-binding instructions, see the FlexReport QuickStart documentation
Step 2: Add a RadarChartField
- On the INSERT tab, select RadarChart.
- Place the chart in the report section where you want it to appear, for example, the Header section.
- Select the chart on the design surface.
- In the Properties window, set the ChartType property to the desired chart type, such as Line.
Step 3: Configure Series Data
- In the Properties window, locate the Series property.
- Click the ellipsis (...) button to open the Series Collection Editor.
- Click Add to create a series.
- For each series, configure the following properties:
| Property | Value |
|---|---|
YExpression |
ProductX, ProductY, or ProductZ |
Label |
Match the selected YExpression |
DataSourceName |
Main |
- Click OK after configuring all series.
Step 4: Configure Category Labels
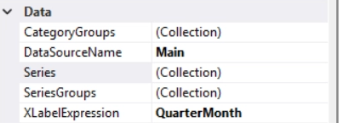
In the chart Data section, set the following properties:
| Property | Value |
|---|---|
DataSourceName |
Main |
XLabelExpression |
QuarterMonth |
Step 5: Preview the Report
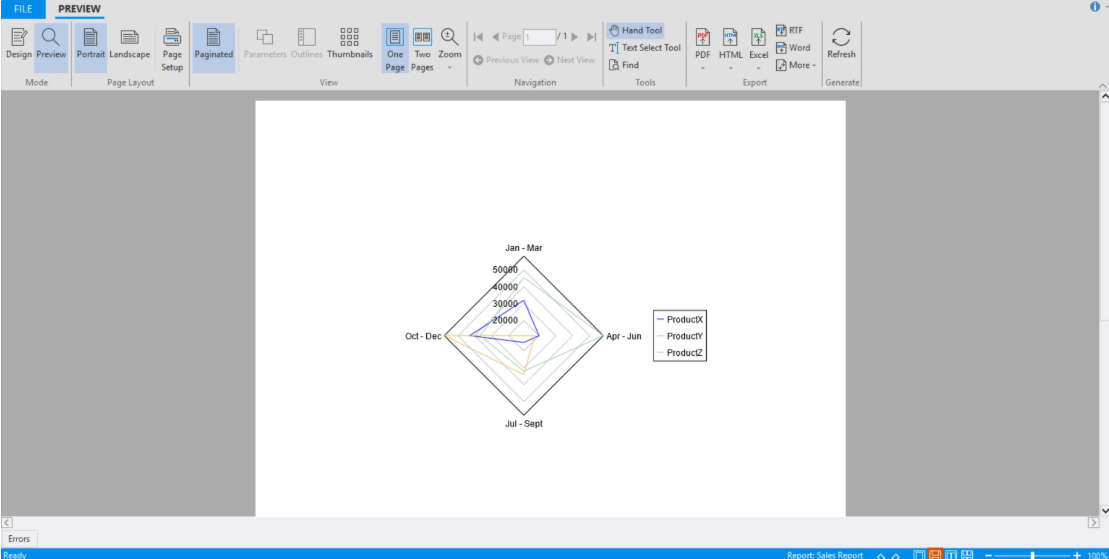
Click Preview to render the report.
RadarChartField and FlexRadar Differences
RadarChartField inherits most of its functionality from FlexRadar. However, RadarChartField is designed specifically for reporting scenarios and uses a reporting-oriented data-binding model.
The primary difference between the two controls is the data-binding implementation:
FlexRadaruses the standard chart binding approach for application UI scenarios.RadarChartFielduses expressions and report data sources that integrate with the FlexReport reporting engine.