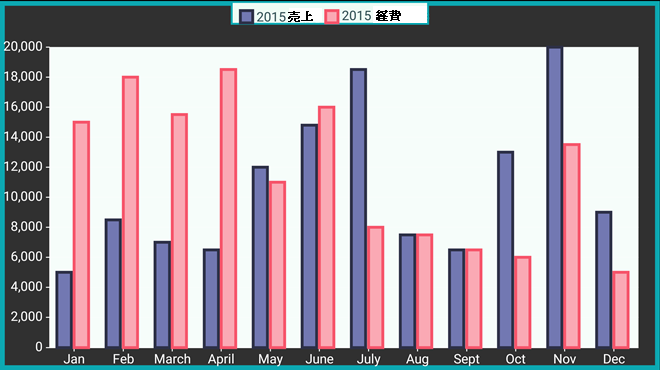
XuniのFlexChartは軸にプロットされたデータのタイプを示すために凡例を表示するオプションを提供します。凡例は、デフォルト位置が“Auto”と設定されていますので、利用可能な領域に応じて自動的に位置を調整します。これでチャートがデバイス上に利用可能な領域を効率的に占めることができます。
凡例を表示する場所とその方法を選択できます。それには、凡例の Position プロパティを設定します。また、BorderColor、BorderWidth、BackgroundColor および LabelFont プロパティを設定して凡例をカスタマイズできます。LegendToggle プロパティを true に設定すると、対応する凡例項目をクリックすることで、任意の系列の表示/非表示を切り替えることができます。
次の図は、これらのプロパティを設定した後の FlexChart を示しています。

 |
|
次のコード例は、C# と XAML でこれらのプロパティを設定する方法を示します。この例では、「外観のカスタマイズ」セクションで作成したサンプルを使用しています。
C# のコード
| C# |
コードのコピー
|
|---|---|
chart.Legend.BorderColor = Color.FromHex("#0CA8B2"); chart.Legend.BorderWidth = 2; chart.Legend.BackgroundColor = Color.FromHex("#EEFCF5"); chart.Legend.LabelTextColor = Color.FromHex("#0CA8B2"); chart.Legend.LabelFont = Font.OfSize("monospace", 12); chart.Legend.LabelTextColor = Color.FromHex("#355358"); chart.LegendToggle = true; chart.Legend.Position = Xuni.Xamarin.ChartCore.ChartPositionType.Top; |
|
XAML のコード
XAML で凡例をカスタマイズするには、アセンブリ Xuni.Forms.ChartCore に参照を追加します。次に例を示します。
| XAML |
コードのコピー
|
|---|---|
<ContentPage xmlns="http://xamarin.com/schemas/2014/forms" xmlns:x="http://schemas.microsoft.com/winfx/2009/xaml" x:Class="Appl.QuickStart" xmlns:xuni="clr-namespace:Xuni.Forms.FlexChart;assembly=Xuni.Forms.FlexChart" xmlns:chartcore="clr-namespace:Xuni.Forms.ChartCore;assembly=Xuni.Forms.ChartCore"> |
|
マークアップを追加して、FlexChart コントロールのマークアップ内でチャート凡例をカスタマイズします。以下に例を示します。
| XAML |
コードのコピー
|
|---|---|
<xuni:FlexChart x:Name="chart" ChartType="Column" ItemsSource="{Binding Data}" BindingX="Name" PlotAreaBackgroundColor="#F6FDFA" BorderColor="#0CA8B2" BorderWidth = "10" LegendToggle="true"> <xuni:FlexChart.Series> <xuni:ChartSeries x:Name="Sales2014" Name="2014 Sales" Binding="Sales" Color="#7278B2" BorderColor="#2D3047" BorderWidth="3"> </xuni:ChartSeries> <xuni:ChartSeries x:Name="Expenses2014" Name="2014 Expenses" Binding="Expenses" Color="#FAA9B4" BorderColor="#F6546A" BorderWidth="3"> </xuni:ChartSeries> </xuni:FlexChart.Series> <xuni:FlexChart.Legend > <chartcore:ChartLegend BorderColor ="#0CA8B2" BorderWidth="2" BackgroundColor="#EEFCF5" LabelFont="12" LabelTextColor="#355358" Position="Top"> </chartcore:ChartLegend> </xuni:FlexChart.Legend> </xuni:FlexChart> |
|