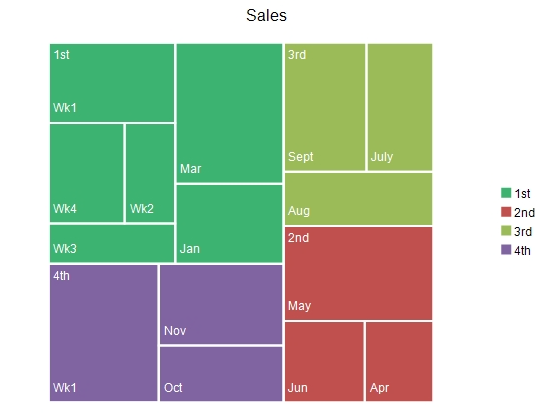
ツリーマップチャートは、階層データを、ネストされた一連の長方形として表示します。ツリーのブランチ(枝)は長方形で表され、個々のサブブランチはさらに小さな長方形で表されます。グラフ内のさまざまな長方形には色とサイズを使い分けて、パターンを特定しやすくします。ツリーマップは、空間を効率的に使用できるという特徴もあり、大量のデータを表示する場合に便利です。

ツリーマップチャートを作成するには、TreemapSeriesクラスおよびTreemapPlotAreaクラスを使用します。
ツリーマップチャート内の各アイテムを色分けするには、Fillsプロパティを使用します。各色は、各データアイテムに対してインデックス順にマッピングされます。次の図は、ツリーマップチャートのデータと各データのインデックスを表しています。後述のサンプルコードでは、この図のとおりに、各データアイテムに色をマッピングする方法を示します。

チャートデザイナを使用したチャートの作成については、「チャートデザイナ」を参照してください。
設定方法
- シートにデータを設定します。
- シートのAddChartメソッドを使用して、1.のデータを参照するチャートを追加します。
サンプルコード
次のサンプルコードは、シートのデータを使用してツリーマップチャートを作成します。
FpSpread1.ActiveSheetView.RowCount = 25;
FpSpread1.ActiveSheetView.ColumnCount = 15;
FpSpread1.ActiveSheetView.PageSize = 25;
FpSpread1.ActiveSheetView.Cells[0, 0].Text = "Quarter";
FpSpread1.ActiveSheetView.Cells[0, 1].Text = "Month";
FpSpread1.ActiveSheetView.Cells[0, 2].Text = "Week";
FpSpread1.ActiveSheetView.Cells[0, 3].Text = "Sales";
FpSpread1.ActiveSheetView.Cells[1, 0].Text = "1st";
FpSpread1.ActiveSheetView.Cells[1, 1].Text = "Jan";
FpSpread1.ActiveSheetView.Cells[1, 3].Value = 1.7;
FpSpread1.ActiveSheetView.Cells[2, 1].Text = "Feb";
FpSpread1.ActiveSheetView.Cells[2, 2].Text = "Wk1";
FpSpread1.ActiveSheetView.Cells[2, 3].Value = 2.0;
FpSpread1.ActiveSheetView.Cells[3, 2].Text = "Wk2";
FpSpread1.ActiveSheetView.Cells[3, 3].Value = 1.0;
FpSpread1.ActiveSheetView.Cells[4, 2].Text = "Wk3";
FpSpread1.ActiveSheetView.Cells[4, 3].Value = 1.0;
FpSpread1.ActiveSheetView.Cells[5, 2].Text = "Wk4";
FpSpread1.ActiveSheetView.Cells[5, 3].Value = 1.5;
FpSpread1.ActiveSheetView.Cells[6, 1].Text = "Mar";
FpSpread1.ActiveSheetView.Cells[6, 3].Value = 3.0;
FpSpread1.ActiveSheetView.Cells[7, 0].Text = "2nd";
FpSpread1.ActiveSheetView.Cells[7, 1].Text = "Apr";
FpSpread1.ActiveSheetView.Cells[7, 3].Value = 1.1;
FpSpread1.ActiveSheetView.Cells[8, 1].Text = "May";
FpSpread1.ActiveSheetView.Cells[8, 3].Value = 2.8;
FpSpread1.ActiveSheetView.Cells[9, 1].Text = "Jun";
FpSpread1.ActiveSheetView.Cells[9, 3].Value = 1.3;
FpSpread1.ActiveSheetView.Cells[10, 0].Text = "3rd";
FpSpread1.ActiveSheetView.Cells[10, 1].Text = "July";
FpSpread1.ActiveSheetView.Cells[10, 3].Value = 1.7;
FpSpread1.ActiveSheetView.Cells[11, 1].Text = "Aug";
FpSpread1.ActiveSheetView.Cells[11, 3].Value = 1.6;
FpSpread1.ActiveSheetView.Cells[12, 1].Text = "Sept";
FpSpread1.ActiveSheetView.Cells[12, 3].Value = 2.1;
FpSpread1.ActiveSheetView.Cells[13, 0].Text = "4th";
FpSpread1.ActiveSheetView.Cells[13, 1].Text = "Oct";
FpSpread1.ActiveSheetView.Cells[13, 3].Value = 1.4;
FpSpread1.ActiveSheetView.Cells[14, 1].Text = "Nov";
FpSpread1.ActiveSheetView.Cells[14, 3].Value = 2.0;
FpSpread1.ActiveSheetView.Cells[15, 1].Text = "Dec";
FpSpread1.ActiveSheetView.Cells[15, 2].Text = "Wk1";
FpSpread1.ActiveSheetView.Cells[15, 3].Value = 3.0;
FpSpread1.ActiveSheetView.AddChart(new FarPoint.Web.Spread.Model.CellRange(0, 0, 16, 4), typeof(FarPoint.Web.Chart.TreemapSeries), 550, 450, 300, 0);
FarPoint.Web.Chart.TreemapSeries treeseries = (FarPoint.Web.Chart.TreemapSeries)FpSpread1.Sheets[0].Charts[0].Model.PlotAreas[0].Series[0];
treeseries.Fills.AddRange(new FarPoint.Web.Chart.Fill[] { new FarPoint.Web.Chart.SolidFill(Color.MediumSeaGreen), null, null, null, null });
FpSpread1.ActiveSheetView.RowCount = 25
FpSpread1.ActiveSheetView.ColumnCount = 15
FpSpread1.ActiveSheetView.PageSize = 25
FpSpread1.ActiveSheetView.Cells(0, 0).Text = "Quarter"
FpSpread1.ActiveSheetView.Cells(0, 1).Text = "Month"
FpSpread1.ActiveSheetView.Cells(0, 2).Text = "Week"
FpSpread1.ActiveSheetView.Cells(0, 3).Text = "Sales"
FpSpread1.ActiveSheetView.Cells(1, 0).Text = "1st"
FpSpread1.ActiveSheetView.Cells(1, 1).Text = "Jan"
FpSpread1.ActiveSheetView.Cells(1, 3).Value = 1.7
FpSpread1.ActiveSheetView.Cells(2, 1).Text = "Feb"
FpSpread1.ActiveSheetView.Cells(2, 2).Text = "Wk1"
FpSpread1.ActiveSheetView.Cells(2, 3).Value = 2.0
FpSpread1.ActiveSheetView.Cells(3, 2).Text = "Wk2"
FpSpread1.ActiveSheetView.Cells(3, 3).Value = 1.0
FpSpread1.ActiveSheetView.Cells(4, 2).Text = "Wk3"
FpSpread1.ActiveSheetView.Cells(4, 3).Value = 1.0
FpSpread1.ActiveSheetView.Cells(5, 2).Text = "Wk4"
FpSpread1.ActiveSheetView.Cells(5, 3).Value = 1.5
FpSpread1.ActiveSheetView.Cells(6, 1).Text = "Mar"
FpSpread1.ActiveSheetView.Cells(6, 3).Value = 3.0
FpSpread1.ActiveSheetView.Cells(7, 0).Text = "2nd"
FpSpread1.ActiveSheetView.Cells(7, 1).Text = "Apr"
FpSpread1.ActiveSheetView.Cells(7, 3).Value = 1.1
FpSpread1.ActiveSheetView.Cells(8, 1).Text = "May"
FpSpread1.ActiveSheetView.Cells(8, 3).Value = 2.8
FpSpread1.ActiveSheetView.Cells(9, 1).Text = "Jun"
FpSpread1.ActiveSheetView.Cells(9, 3).Value = 1.3
FpSpread1.ActiveSheetView.Cells(10, 0).Text = "3rd"
FpSpread1.ActiveSheetView.Cells(10, 1).Text = "July"
FpSpread1.ActiveSheetView.Cells(10, 3).Value = 1.7
FpSpread1.ActiveSheetView.Cells(11, 1).Text = "Aug"
FpSpread1.ActiveSheetView.Cells(11, 3).Value = 1.6
FpSpread1.ActiveSheetView.Cells(12, 1).Text = "Sept"
FpSpread1.ActiveSheetView.Cells(12, 3).Value = 2.1
FpSpread1.ActiveSheetView.Cells(13, 0).Text = "4th"
FpSpread1.ActiveSheetView.Cells(13, 1).Text = "Oct"
FpSpread1.ActiveSheetView.Cells(13, 3).Value = 1.4
FpSpread1.ActiveSheetView.Cells(14, 1).Text = "Nov"
FpSpread1.ActiveSheetView.Cells(14, 3).Value = 2.0
FpSpread1.ActiveSheetView.Cells(15, 1).Text = "Dec"
FpSpread1.ActiveSheetView.Cells(15, 2).Text = "Wk1"
FpSpread1.ActiveSheetView.Cells(15, 3).Value = 3.0
FpSpread1.ActiveSheetView.AddChart(New FarPoint.Web.Spread.Model.CellRange(0, 0, 16, 4), GetType(FarPoint.Web.Chart.TreemapSeries), 550, 450, 300, 0)
Dim treeseries As FarPoint.Web.Chart.TreemapSeries = DirectCast(FpSpread1.Sheets(0).Charts(0).Model.PlotAreas(0).Series(0), FarPoint.Web.Chart.TreemapSeries)
treeseries.Fills.AddRange(New FarPoint.Web.Chart.Fill() {New FarPoint.Web.Chart.SolidFill(System.Drawing.Color.MediumSeaGreen), Nothing, Nothing, Nothing, Nothing})
次のサンプルコードは、上で示した図のとおりに各データアイテムに色をマッピングします。
FarPoint.Web.Chart.TreemapSeries series = new FarPoint.Web.Chart.TreemapSeries();
series.Values.AddRange(new double[] { 3.5, 1.2, 0.8, 0.6, 0.5, 1.7, 1.1, 0.7, 1.3, 2.0 });
series.Fills.AddRange(new FarPoint.Web.Chart.Fill[] {
    new FarPoint.Web.Chart.SolidFill(Color.Blue),
    new FarPoint.Web.Chart.SolidFill(Color.Aqua),
    new FarPoint.Web.Chart.SolidFill(Color.Coral),
    new FarPoint.Web.Chart.SolidFill(Color.Lavender),
    new FarPoint.Web.Chart.SolidFill(Color.Lavender),
    new FarPoint.Web.Chart.SolidFill(Color.Lavender),
    new FarPoint.Web.Chart.SolidFill(Color.Lavender),
    new FarPoint.Web.Chart.SolidFill(Color.Olive),
    new FarPoint.Web.Chart.SolidFill(Color.Orange),
    new FarPoint.Web.Chart.SolidFill(Color.Beige),
    new FarPoint.Web.Chart.SolidFill(Color.Firebrick),
    new FarPoint.Web.Chart.SolidFill(Color.Gray),
    new FarPoint.Web.Chart.SolidFill(Color.Magenta) });
FarPoint.Web.Chart.StringCollectionItem collection1 = new FarPoint.Web.Chart.StringCollectionItem();
collection1.AddRange(new String[] { "1st", "", "", "", "", "", "2nd", "", "", "3rd" });
FarPoint.Web.Chart.StringCollectionItem collection2 = new FarPoint.Web.Chart.StringCollectionItem();
collection2.AddRange(new String[] { "Jan", "Feb", "", "", "", "Mar", "Apr", "May", "June", "July" });
FarPoint.Web.Chart.StringCollectionItem collection3 = new FarPoint.Web.Chart.StringCollectionItem();
collection3.AddRange(new String[] { "", "Week1", "Week2", "Week3", "Week4", "", "", "", "", "" });
series.CategoryNames.AddRange(new FarPoint.Web.Chart.StringCollectionItem[] { collection1, collection2, collection3 });
FarPoint.Web.Chart.TreemapPlotArea plotArea = new FarPoint.Web.Chart.TreemapPlotArea();
plotArea.Location = new PointF(0.2f, 0.2f);
plotArea.Size = new SizeF(0.6f, 0.6f);
plotArea.Series.Add(series);
FarPoint.Web.Chart.ChartModel model = new FarPoint.Web.Chart.ChartModel();
model.PlotAreas.Add(plotArea);
FarPoint.Web.Spread.Chart.SpreadChart chart = new FarPoint.Web.Spread.Chart.SpreadChart();
chart.Width = 500;
chart.Height = 500;
chart.Model = model;
FpSpread1.Sheets[0].Charts.Add(chart);
Dim series As New FarPoint.Web.Chart.TreemapSeries()
series.Values.AddRange(New Double() {3.5, 1.2, 0.8, 0.6, 0.5, 1.7, 1.1, 0.7, 1.3, 2.0})
series.Fills.AddRange(New FarPoint.Web.Chart.Fill() {
                        New FarPoint.Web.Chart.SolidFill(Color.Blue),
                        New FarPoint.Web.Chart.SolidFill(Color.Aqua),
                        New FarPoint.Web.Chart.SolidFill(Color.Coral),
                        New FarPoint.Web.Chart.SolidFill(Color.Lavender),
                        New FarPoint.Web.Chart.SolidFill(Color.Lavender),
                        New FarPoint.Web.Chart.SolidFill(Color.Lavender),
                        New FarPoint.Web.Chart.SolidFill(Color.Lavender),
                        New FarPoint.Web.Chart.SolidFill(Color.Olive),
                        New FarPoint.Web.Chart.SolidFill(Color.Orange),
                        New FarPoint.Web.Chart.SolidFill(Color.Beige),
                        New FarPoint.Web.Chart.SolidFill(Color.Firebrick),
                        New FarPoint.Web.Chart.SolidFill(Color.Gray),
                        New FarPoint.Web.Chart.SolidFill(Color.Magenta)})
Dim collection1 As New FarPoint.Web.Chart.StringCollectionItem()
collection1.AddRange(New [String]() {"1st", "", "", "", "", "", "2nd", "", "", "3rd"})
Dim collection2 As New FarPoint.Web.Chart.StringCollectionItem()
collection2.AddRange(New [String]() {"Jan", "Feb", "", "", "", "Mar", "Apr", "May", "June", "July"})
Dim collection3 As New FarPoint.Web.Chart.StringCollectionItem()
collection3.AddRange(New [String]() {"", "Week1", "Week2", "Week3", "Week4", "", "", "", "", ""})
series.CategoryNames.AddRange(New FarPoint.Web.Chart.StringCollectionItem() {collection1, collection2, collection3})
Dim plotArea As New FarPoint.Web.Chart.TreemapPlotArea()
plotArea.Location = New PointF(0.2F, 0.2F)
plotArea.Size = New SizeF(0.6F, 0.6F)
plotArea.Series.Add(series)
Dim model As New FarPoint.Web.Chart.ChartModel()
model.PlotAreas.Add(plotArea)
Dim chart As New FarPoint.Web.Spread.Chart.SpreadChart()
chart.Width = 500
chart.Height = 500
chart.Model = model
FpSpread1.Sheets(0).Charts.Add(chart)
関連トピック