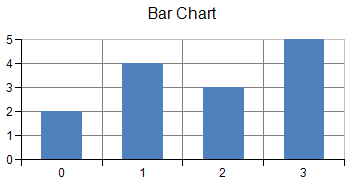
Yプロットチャートは、YPlotArea クラスで定義されます。次の図は、Yプロットチャート(棒チャート)の例です。
Yプロットチャートに追加可能な系列は、YSeries クラス を継承する以下のクラスです。
- AreaSeries
- BarSeries
- CandlestickSeries
- HighLowAreaSeries
- HighLowBarSeries
- HighLowCloseSeries
- LineSeries
- PointSeries
また、複数の系列をもつ集合データ系列(集合棒チャート、積み上げ棒チャート)を追加することも可能です。以下のクラスはそれぞれSeries プロパティから系列コレクションを参照します。
設定方法
- 系列オブジェクトを生成します。
- YPlotArea クラスを生成し、Location プロパティやSize プロパティを設定します。
- 1.で生成した系列オブジェクトをSeries プロパティが参照する系列コレクションに追加します。
- ChartModel クラスを生成し、PlotAreas プロパティが参照するプロットエリアコレクションに2.で生成したYPlotAreaオブジェクトを追加します。
- SpreadChart クラスを生成し、Model プロパティに4.で生成したCharModelオブジェクトを設定します。
サンプルコード
次のサンプルコードは、Yプロットチャートを作成し、非連結データをコントロールに追加します。ラベルエリアや凡例エリアも追加しています。
FarPoint.Web.Chart.BarSeries series = new FarPoint.Web.Chart.BarSeries();
series.SeriesName = "Series 0";
series.Values.Add(2.0);
series.Values.Add(4.0);
series.Values.Add(3.0);
series.Values.Add(5.0);
FarPoint.Web.Chart.YPlotArea plotArea = new FarPoint.Web.Chart.YPlotArea();
plotArea.Location = new PointF(0.2f, 0.2f);
plotArea.Size = new SizeF(0.6f, 0.6f);
plotArea.Series.Add(series);
FarPoint.Web.Chart.LabelArea label = new FarPoint.Web.Chart.LabelArea();
label.Text = "Bar Chart";
label.Location = new PointF(0.5f, 0.02f);
label.AlignmentX = 0.5f;
label.AlignmentY = 0.0f;
FarPoint.Web.Chart.LegendArea legend = new FarPoint.Web.Chart.LegendArea();
legend.Location = new PointF(0.98f, 0.5f);
legend.AlignmentX = 1.0f;
legend.AlignmentY = 0.5f;
FarPoint.Web.Chart.ChartModel model = new FarPoint.Web.Chart.ChartModel();
model.LabelAreas.Add(label);
model.LegendAreas.Add(legend);
model.PlotAreas.Add(plotArea);
FarPoint.Web.Spread.Chart.SpreadChart chart = new FarPoint.Web.Spread.Chart.SpreadChart();
chart.Model = model;
FpSpread1.Sheets[0].Charts.Add(chart);
Dim series As New FarPoint.Web.Chart.BarSeries()
series.SeriesName = "Series 0"
series.Values.Add(2.0)
series.Values.Add(4.0)
series.Values.Add(3.0)
series.Values.Add(5.0)
Dim plotArea As New FarPoint.Web.Chart.YPlotArea()
plotArea.Location = New PointF(0.2F, 0.2F)
plotArea.Size = New SizeF(0.6F, 0.6F)
plotArea.Series.Add(series)
Dim label As New FarPoint.Web.Chart.LabelArea()
label.Text = "Bar Chart"
label.Location = New PointF(0.5F, 0.02F)
label.AlignmentX = 0.5F
label.AlignmentY = 0.0F
Dim legend As New FarPoint.Web.Chart.LegendArea()
legend.Location = New PointF(0.98F, 0.5F)
legend.AlignmentX = 1.0F
legend.AlignmentY = 0.5F
Dim model As New FarPoint.Web.Chart.ChartModel()
model.LabelAreas.Add(label)
model.LegendAreas.Add(legend)
model.PlotAreas.Add(plotArea)
Dim chart As New FarPoint.Web.Spread.Chart.SpreadChart()
chart.Model = model
FpSpread1.Sheets(0).Charts.Add(chart)
関連トピック