Wijmo UI for the Web
legend オプション
| wijmo.chart.wijchartcore 名前空間 > options タイプ : legend オプション |
チャートとともに表示する凡例オブジェクトを作成します。
型: wijmo.chart.chart_legend オブジェクト
デフォルト値:
{ compass: "east", orientation: "vertical", style: {fill: "#none", stroke: "none"}, text: "", textMargin: {left: 2, top: 2, right: 2, bottom: 2 }, textStyle: {fill: "#333", stroke: "none"}, titleStyle: {"font-weight": "bold", fill: "#000", stroke: "none"}, visible: true } | Javascript (Usage) | |
|---|---|
$(function () { //値を取得する var returnsValue; //タイプ: wijmo.chart.chart_legend returnsValue = $(".selector").wijchartcore("option", "legend"); //値を設定します var newValue; //タイプ: wijmo.chart.chart_legend $(".selector").wijchartcore("option", "legend", newValue); }); | |
| Javascript (Specification) | |
|---|---|
var legend : chart_legend; | |
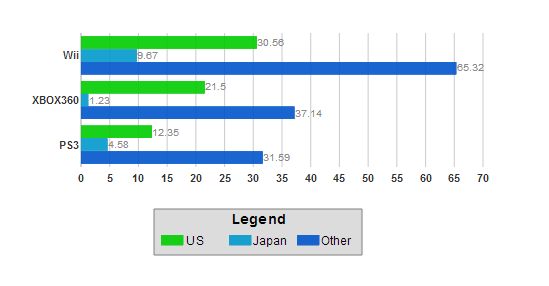
以下のコードは、凡例を持つチャートを作成します。凡例はチャートの下部(south)に配置され、系列ラベルと色が横向き(horizontal)に並べられます。塗りつぶし色は明るい灰色、輪郭色は灰色で(style)、"Legend" というタイトルが付いています(text)。テキストの周囲には 5 ピクセルの余白があり(textMargin)、系列ラベルは 12 ポイントの黒のフォント(textStyle)、タイトルは 14 ポイントのフォント(titleStyle)で表示されます。このコードの実行結果は下の図のようになります。

<script id="scriptInit" type="text/javascript">
    $(document).ready(function () {
        $("#wijbarchart").wijbarchart({
            legend: {
                compass: "south",
                orientation: "horizontal",
                style: {fill: "gainsboro", stroke: "grey"},
                text: "Legend",
                textMargin: {left: 5, top: 5, right: 5, bottom: 5 },
                textStyle: {fill: "black", "font-size": 12},
                titleStyle: {"font-size": 14}
            },
            seriesList: [{
                label: "US",
                data: {
                    x: ['PS3', 'XBOX360', 'Wii'],
                    y: [12.35, 21.50, 30.56]
                }
            },
            {
                label: "Japan",
                data: {
                    x: ['PS3', 'XBOX360', 'Wii'],
                    y: [4.58, 1.23, 9.67]
                }
            },
            {
                label: "Other",
                data: {
                    x: ['PS3', 'XBOX360', 'Wii'],
                    y: [31.59, 37.14, 65.32]
                }
            }],
        });
    });
</script>
デフォルトでは、seriesList に作成する各系列は、指定した seriesList ラベルを使用して凡例に色分けして表現されます。ラベルを指定しない場合は、"undefined" というラベルになります。凡例に系列を表示しない場合は、seriesList の legendEntry 属性を false に設定します。
デフォルトでは、凡例エントリをクリックすると、その凡例に対応するデータ系列の表示/非表示が切り替わります。この機能を無効にするコードについては、「クリック可能な凡例」を参照してください。