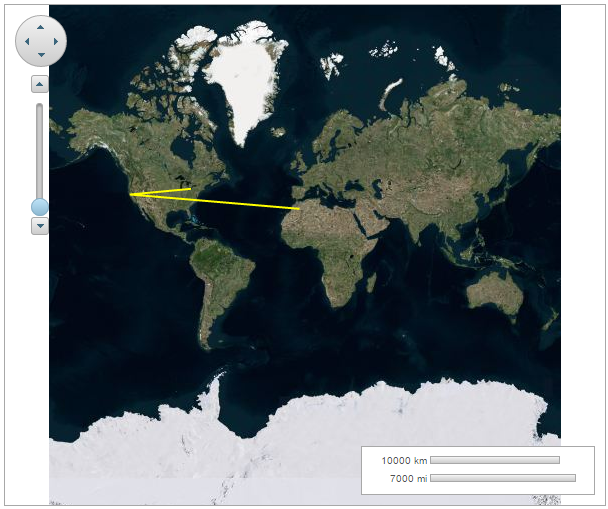
地理座標を折れ線で結ぶには、C1VectorLayer(詳細については、「ベクターレイヤ」を参照してください)にC1VectorPolylineを追加します。このトピックでは、3つの点から成る折れ線を作成します。
デザイナの場合
- コントロールを右クリックし、コンテキストメニューから[プロパティ]を選択してプロパティウィンドウを開きます。
- Layersプロパティの横にある省略符ボタン(...)をクリックして、C1Layersコレクションエディタを開きます。
- [追加]ボタンのドロップダウン矢印をクリックし、C1VectorLayerを選択します。C1LayersコレクションにC1VectorLayerが追加され、C1Layersコレクションエディタの右側にそのプロパティが表示されます。
- Dataプロパティグループを展開し、DataTypeをWijJsonに設定します。
- Vectorsプロパティの横にある省略符ボタン(...)をクリックして、C1VectorItemBaseコレクションエディタを開きます。
- [追加]ボタンのドロップダウン矢印をクリックし、C1VectorPolylineを選択します。C1VectorItemBaseコレクションにC1VectorPolylineが追加され、C1VectorItemBaseコレクションエディタの右側にそのプロパティが表示されます。
- Fill、FillOpacity、Stroke、StrokeOpacity、StrokeWidthなどを任意に設定します。
- Pointsプロパティの横にある省略符ボタン(...)をクリックして、PointDコレクションエディタを開きます。
-
[追加]ボタンを 3回クリックします。次のように、各ポイントのX座標とY座標を設定します。
Point X Y 0 -80.15 42.12 1 -123.08 39.09 2 -3.90 30.85 - [OK]をクリックして、PointDコレクションエディタを閉じます。
- [OK]をクリックして、C1VectorItemBaseコレクションエディタを閉じます。
- [OK]をクリックして、C1Layersコレクションエディタを閉じます。
- [F5]キーを押してプロジェクトを実行します。
マップのスケールに応じて要素の表示/非表示を操作する方法については、トピック「ベクターレイヤ」の「要素の表示/非表示」セクションを参照してください。
ソースビューの場合
次のマークアップを<c1:C1Maps> </c1:C1Maps>タグの間に追加します。
| ソースビュー |
コードのコピー
|
|---|---|
<Layers> <c1:C1VectorLayer> <DataWijJson> <Vectors> <c1:C1VectorPolyline FillOpacity="0" Stroke="Yellow" StrokeWidth="2"> <Points> <c1:PointD X="-80.15" Y="42.12" /> <c1:PointD X="-123.08" Y="39.09" /> <c1:PointD X="-3.9" Y="30.85" /> </Points> </c1:C1VectorPolyline> </Vectors> </DataWijJson> </c1:C1VectorLayer> </Layers> |
|
コードの場合
- 次のコードを Page_Load イベントに追加します。
C# コードのコピー// レイヤを作成してマップに追加します。 C1VectorLayer vl = new C1VectorLayer(); C1Maps1.Layers.Add(vl); // データソースの種類を設定します。 vl.DataType = DataType.WijJson; //ベクター折れ線を作成してレイヤに追加します。 C1VectorPolyline vpl = new C1VectorPolyline(); vl.DataWijJson.Vectors.Add(vpl); // ベクター折れ線に点を追加します。 vpl.Points.Add(new PointD(-80.15, 42.12)); vpl.Points.Add(new PointD(-123.08, 39.09)); vpl.Points.Add(new PointD(-3.90, 30.85)); // 描線の色と幅を設定します。 vpl.Stroke = System.Drawing.Color.Yellow; vpl.StrokeWidth = 2;
VB コードのコピー' レイヤを作成してマップに追加します。 Dim vl As New C1VectorLayer() C1Maps1.Layers.Add(vl) ' 使用するデータソースの種類を設定します。 vl.DataType = DataType.WijJson 'ベクター折れ線を作成してレイヤに追加します。 Dim vpl As New C1VectorPolyline() vl.DataWijJson.Vectors.Add(vpl) ' ベクター折れ線に点を追加します。 vpl.Points.Add(New PointD(-80.15, 42.12)) vpl.Points.Add(New PointD(-123.08, 39.09)) vpl.Points.Add(New PointD(-3.9, 30.85)) ' 描線の色と幅を設定します。 vpl.Stroke = System.Drawing.Color.Yellow vpl.StrokeWidth = 2
- プロジェクトを実行します。
ここまでの成果
次の図は、C1Mapsコントロールで3つの地理座標を折れ線で結んで表示したところです。