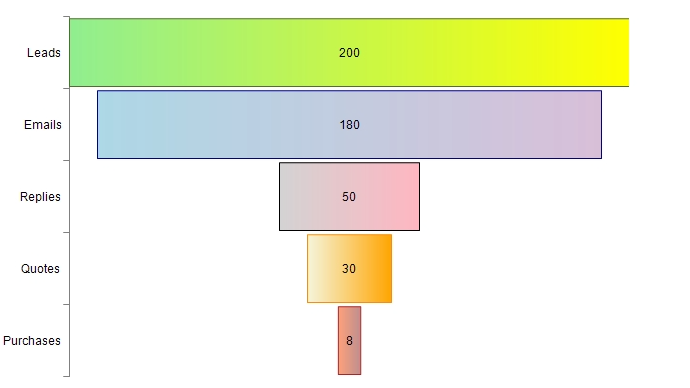
じょうごチャートは、複数の段階にわたって値を表示します。通常、段階を経るごとに、表示される値が減少します。
じょうごチャートは、売上などのデータを表すのに便利です。たとえば、Webサイトの訪問者のうち、製品を実際に購入したのは何人となるかを表します。

じょうごチャートを追加するには、FunnelSeriesクラスおよびYPlotAreaクラスを使用します。
チャートデザイナを使用したチャートの作成については、「チャートデザイナ」を参照してください。
設定方法
- FunnelSeriesクラスを使用して、データをChartコントロールに追加します。
- YPlotAreaクラスを使用して、プロットエリアを作成します。
- プロットエリアの位置とサイズを設定します。
- プロットエリアに系列を追加します。
- チャートモデルを作成し、このモデルにプロットエリアを追加します。
- チャートを作成し、このチャートにチャートモデルを追加します。
- チャートをSPREADに追加します。
サンプルコード
次のサンプルコードは、じょうごチャートを作成します。
FarPoint.Web.Chart.FunnelSeries funnel = new FarPoint.Web.Chart.FunnelSeries();
funnel.Values.Add(200);
funnel.Values.Add(180);
funnel.Values.Add(50);
funnel.Values.Add(30);
funnel.Values.Add(8);
funnel.CategoryNames.Add("Leads");
funnel.CategoryNames.Add("Emails");
funnel.CategoryNames.Add("Replies");
funnel.CategoryNames.Add("Quotes");
funnel.CategoryNames.Add("Purchases");

funnel.BarFills.AddRange(new FarPoint.Web.Chart.GradientFill[] { new FarPoint.Web.Chart.GradientFill(Color.LightGreen, Color.Yellow), new FarPoint.Web.Chart.GradientFill(Color.LightBlue, Color.Thistle), new FarPoint.Web.Chart.GradientFill(Color.LightGray, Color.LightPink), new FarPoint.Web.Chart.GradientFill(Color.Beige, Color.Orange), new FarPoint.Web.Chart.GradientFill(Color.LightSalmon, Color.RosyBrown) });
funnel.BarBorders.AddRange(new FarPoint.Web.Chart.Line[] { new FarPoint.Web.Chart.SolidLine(Color.DarkOliveGreen), new FarPoint.Web.Chart.SolidLine(Color.DarkBlue), new FarPoint.Web.Chart.SolidLine(Color.Black), new FarPoint.Web.Chart.SolidLine(Color.DarkOrange), new FarPoint.Web.Chart.SolidLine(Color.Firebrick) });

FarPoint.Web.Chart.YPlotArea plotArea = new FarPoint.Web.Chart.YPlotArea();
plotArea.Location = new PointF(0.2f, 0.2f);
plotArea.Size = new SizeF(0.6f, 0.6f);
plotArea.XAxis.Reverse = true;
plotArea.Vertical = false;
plotArea.Series.Add(funnel);
FarPoint.Web.Chart.ChartModel model = new FarPoint.Web.Chart.ChartModel();
model.PlotAreas.Add(plotArea);
FarPoint.Web.Spread.Chart.SpreadChart chart = new FarPoint.Web.Spread.Chart.SpreadChart();
chart.Model = model;
chart.Left = 0;
chart.Top = 150;
chart.Height = 400;
chart.Width = 700;
FpSpread1.ActiveSheetView.Charts.Add(chart);
Dim funnel As New FarPoint.Web.Chart.FunnelSeries()
funnel.Values.Add(200)
funnel.Values.Add(180)
funnel.Values.Add(50)
funnel.Values.Add(30)
funnel.Values.Add(8)
funnel.CategoryNames.Add("Leads")
funnel.CategoryNames.Add("Emails")
funnel.CategoryNames.Add("Replies")
funnel.CategoryNames.Add("Quotes")
funnel.CategoryNames.Add("Purchases")

funnel.BarFills.AddRange(New FarPoint.Web.Chart.GradientFill() {New FarPoint.Web.Chart.GradientFill(Drawing.Color.LightGreen, Drawing.Color.Yellow), New FarPoint.Web.Chart.GradientFill(Drawing.Color.LightBlue, Drawing.Color.Thistle), New FarPoint.Web.Chart.GradientFill(Drawing.Color.LightGray, Drawing.Color.LightPink), New FarPoint.Web.Chart.GradientFill(Drawing.Color.Beige, Drawing.Color.Orange), New FarPoint.Web.Chart.GradientFill(Drawing.Color.LightSalmon, Drawing.Color.RosyBrown)})
funnel.BarBorders.AddRange(New FarPoint.Web.Chart.Line() {New FarPoint.Web.Chart.SolidLine(Drawing.Color.DarkOliveGreen), New FarPoint.Web.Chart.SolidLine(Drawing.Color.DarkBlue), New FarPoint.Web.Chart.SolidLine(Drawing.Color.Black), New FarPoint.Web.Chart.SolidLine(Drawing.Color.DarkOrange), New FarPoint.Web.Chart.SolidLine(Drawing.Color.Firebrick)})

Dim plotArea As New FarPoint.Web.Chart.YPlotArea()
plotArea.Location = New Drawing.PointF(0.2F, 0.2F)
plotArea.Size = New Drawing.SizeF(0.6F, 0.6F)
plotArea.XAxis.Reverse = True
plotArea.Vertical = False
plotArea.Series.Add(funnel)
Dim model As New FarPoint.Web.Chart.ChartModel()
model.PlotAreas.Add(plotArea)
Dim chart As New FarPoint.Web.Spread.Chart.SpreadChart()
chart.Model = model
chart.Left = 0
chart.Top = 150
chart.Width = 700
chart.Height = 400
FpSpread1.ActiveSheetView.Charts.Add(chart)
関連トピック