Wijmo UI for the Web
calloutFilled フィールド
| wijmo.chart 名前空間 > chart_hint インターフェース : calloutFilled フィールド |
| Javascript (Usage) | |
|---|---|
var instance; //タイプ:wijmo.chart.chart_hint; var value; // Type: boolean value = instance.calloutFilled; | |
| Javascript (Specification) | |
|---|---|
var calloutFilled : boolean; | |
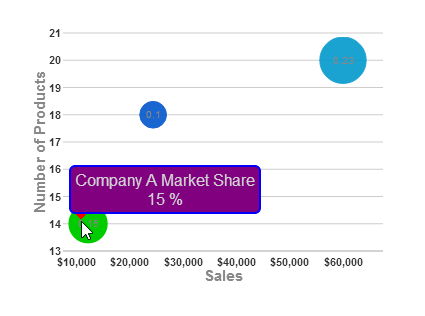
以下のサンプルは、各種要素を見分けやすくするため、ヒントの calloutFilled 属性を true に設定し、calloutFilledStyle の塗りつぶし色と輪郭色を赤に設定し、ヒントの style を青い輪郭の紫に設定します。

<script type="text/javascript">
$(document).ready(function () {
    $("#wijbubblechart").wijbubblechart({
        axis: {
            y: {text: "Number of Products"},
            x: {text: "Sales", annoFormatString: "C0"}
        },
        hint: {
            calloutFilled: true,
            calloutFilledStyle: {fill: "red", stroke: "red"},
            style: {fill: "purple", "stroke-width": "2", stroke: "blue"},
            content: function(){
                return this.data.label + '\n' +
                Globalize.format(this.y1, "p0") + ' ';
            }
        },
        legend: {visible: false},
        seriesList: [
        {
            label: "Company A Market Share",
            data: { y: [14], x: [12200], y1: [.15] }
        }, {
            label: "Company B Market Share",
            data: { y: [20], x: [60000], y1: [.23] }
        }, {
            label: "Company C Market Share",
            data: { y: [18], x: [24400], y1: [.1] }
        }]
    });
});
</script>