Wijmo UI for the Web
header フィールド
| wijmo.chart.wijbarchart 名前空間 > options タイプ : header フィールド |
棒グラフのヘッダとして使用するオブジェクトを設定します。
型: wijmo.chart.chart_title オブジェクト
デフォルト値:
{ compass:"south", orientation:"horizontal", style: {fill: "#fff", stroke: "none"}, text: "", textStyle: {fill: "#000", stroke: "none"}, visible: false }| Javascript (Usage) | |
|---|---|
$(function () { //値を取得する var returnsValue; //タイプ: wijmo.chart.chart_title returnsValue = $(".selector").wijbarchart("option", "header"); //値を設定します var newValue; //タイプ: wijmo.chart.chart_title $(".selector").wijbarchart("option", "header", newValue); }); | |
| Javascript (Specification) | |
|---|---|
var header : chart_title; | |
以下のコードは、次の図のようなヘッダを持つチャートを作成します。
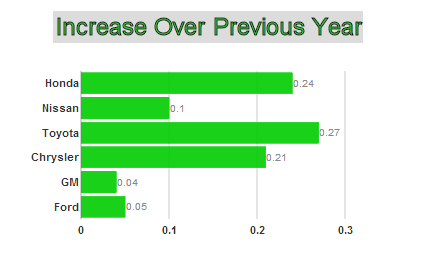
<script id="scriptInit" type="text/javascript">
    $(document).ready(function () {
        $("#wijbarchart").wijbarchart({
            header: {
                style: {fill: "gainsboro"},
                text: "Increase Over Previous Year ",
                textStyle: {"font-size": 24, fill:"limegreen", stroke:"black"}
            },
            seriesList: [{
                legendEntry: false,
                data: {
                    x: ['Ford', 'GM', 'Chrysler', 'Toyota', 'Nissan', 'Honda'],
                    y: [.05, .04, .21, .27, .1, .24]
                }
            }],
        });
    });
</script>