Wijmo UI for the Web
hint フィールド
| wijmo.chart.wijbarchart 名前空間 > options タイプ : hint フィールド |
マウスをチャート要素に合わせたときに表示されるツールチップ(ヒント)として使用するオブジェクトを作成します。
デフォルト値:
{ animated: "fade", calloutFilled: false, calloutFilledStyle: {fill: "#000"}, compass: "north", content: null, contentStyle: {fill: "#d1d1d1", "font-size": 16}, duration: 120, easing: "easeOutExpo", enable: true, hideAnimated: "fade", hideDelay: 150, hideDuration: 120, hideEasing: "easeOutExpo", offsetX: 0, offsetY: 0, showAnimated: "fade", showCallout: true, showDelay: 150, showDuration: 120, showEasing: "easeOutExpo", style: {fill: "270-#333333-#000000", "stroke-width": "2"}, title: null, titleStyle: {fill: "#d1d1d1", "font-size": 16}, } | Javascript (Usage) | |
|---|---|
$(function () { //値を取得する var returnsValue; //タイプ: wijmo.chart.chart_hint returnsValue = $(".selector").wijbarchart("option", "hint"); //値を設定します var newValue; //タイプ: wijmo.chart.chart_hint $(".selector").wijbarchart("option", "hint", newValue); }); | |
| Javascript (Specification) | |
|---|---|
var hint : chart_hint; | |
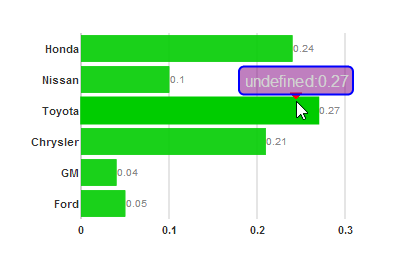
以下のサンプルは、各種要素を見分けやすくするため、ヒントの calloutFilled 属性を true に設定し、calloutFilledStyle の塗りつぶし色と輪郭色を赤に設定し、ヒントの style を青い輪郭の紫に設定します。

<script id="scriptInit" type="text/javascript">
    $(document).ready(function () {
        $("#wijbarchart").wijbarchart({
            hint: {
                calloutFilled: true,
                calloutFilledStyle: {fill: "red", stroke: "red"},
                style: {fill: "purple", "stroke-width": "2", stroke: "blue"}
            },
            seriesList: [{
                legendEntry: false,
                data: {
                    x: ['Ford', 'GM', 'Chrysler', 'Toyota', 'Nissan', 'Honda'],
                    y: [.05, .04, .21, .27, .1, .24]
                }
            }],
        });
    });
</script>